Idaho State University Math 1153
Professor Jacobsen · Idaho State University · 19 lectures with notes
Students in this class: ask your lecturer for the class code, and these lectures will already be in your library when you sign up.
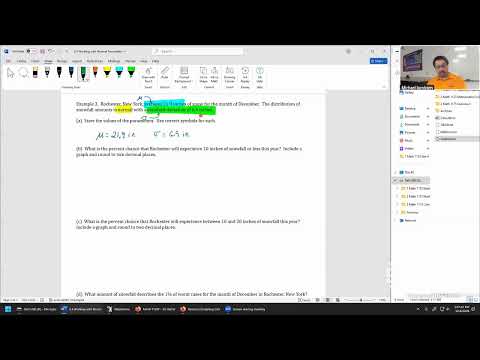
Math 1153 - 6 October 2026 - Section 5.4
Use a normal-curve sketch to choose the right calculator function, bounds, and tail for probability and percentile questions.
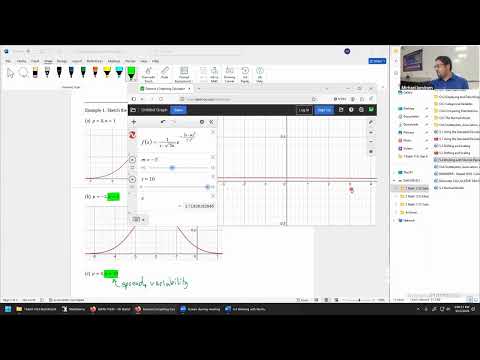
Math 1153 5 October 2026 Sections 5.3, 5.4
Normal-distribution problems require translating context into shaded regions, population parameters, and probabilities or cutoff values.
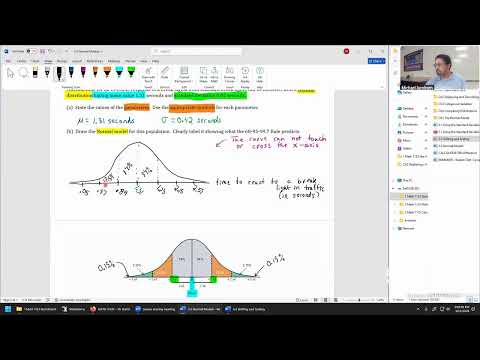
Math 1153 - 1 October 2026 - Sections 5.2, 5.3
A linear transformation changes positions and spread differently; normal models use the 68–95–99.7 rule when data are roughly symmetric.
Math 1153 - 29 September 2026 - Sections 5.1, 5.2
Z-scores enable fair comparisons across different tests, while Section 5.2 explains how shifting and rescaling data change statistical summaries.
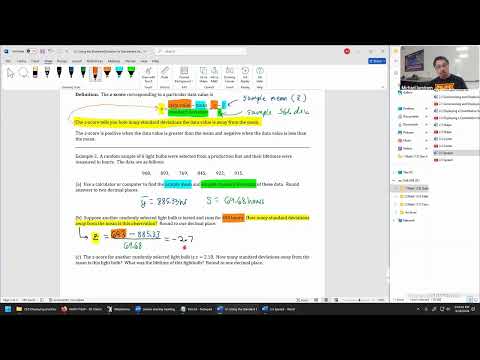
Math 1153 - 28 September 2026 - Chapter 4, 5.1
Z-scores measure how many standard deviations a value lies from its mean, while grouped box plots reveal patterns hidden in overall distributions.
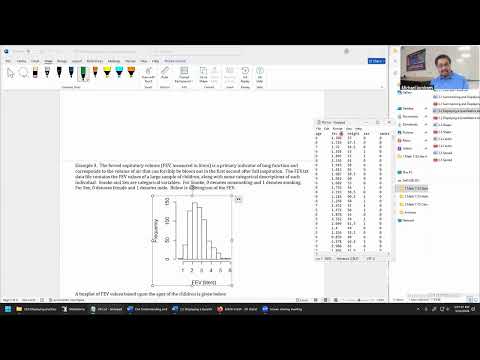
Math 1153 - 24 September 2026 - Chapter 4
Build a box plot from a five-number summary, use 1.5×IQR to flag outliers, and interpret the distribution in context.
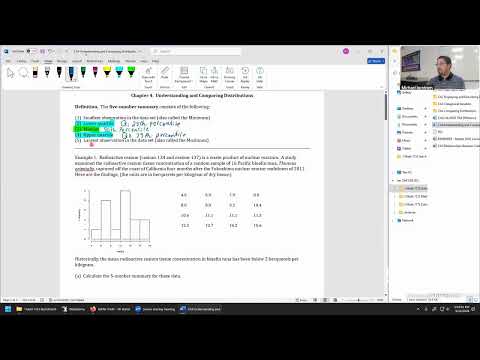
Math 1153 - 22 September 2026 - Ch3
Tattoo history and hepatitis C are strongly associated in the study, but observational data cannot show that tattoos cause the infection.
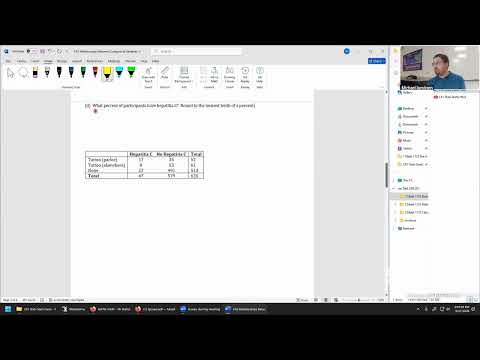
Math 1153 - 17 September 2026 - Sections 2.5, Chapter 3
Use median and IQR for skewed data, then read two-way tables by distinguishing marginal from conditional distributions.
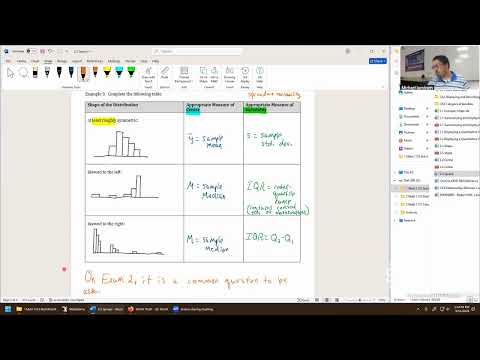
Math 1153 - 15 September 2026 - Section 2.5
Choose mean and standard deviation for roughly symmetric data; use median and IQR when distributions are strongly skewed.
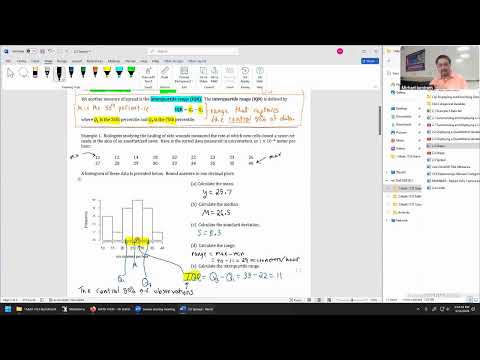
Math 1153 - 14 September 2026 - Sections 2.4, 2.5
Use distribution shape to choose between mean and median, and between standard deviation and IQR, then calculate the statistics with a TI-84.
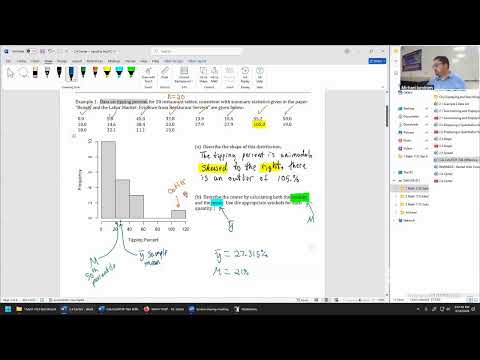
Math 1153 - 10 September 2026 - Sections 2.4
A TI-84 walkthrough finds a 27.315% mean and 21% median for skewed restaurant-tip data.
Math 1153 - 8 September 2026 - Sections 2.3, 2.4
Learn to describe quantitative distributions by mode, skew, and outliers, then preview mean and median calculations with a TI-84.
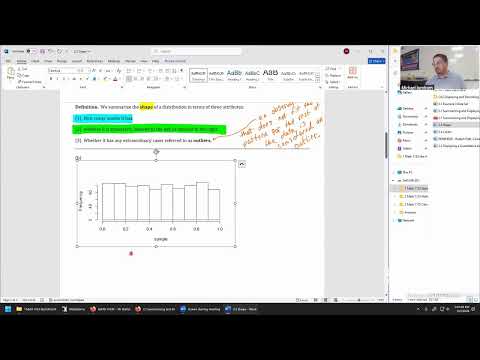
Math 1153 - 3 September 2026 - Sections 2.2, 2.3
Describe quantitative distributions by identifying their modes, symmetry or skew, and any outliers.
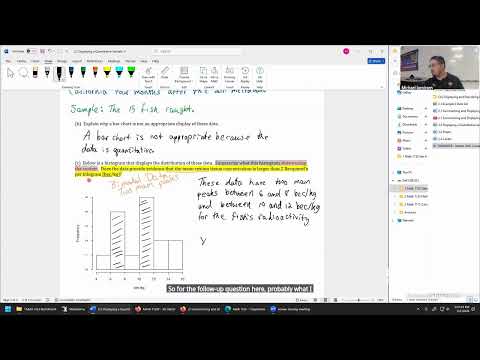
Math 1153 - 1 September 2026 - Section 2.1
Dot plots and histograms reveal the shape, center, and spread of quantitative data—and require interpretation in context.
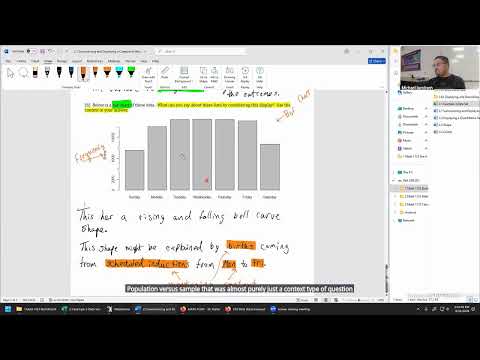
Math 1153 - 31 August 2026 - Section 2.1
Turn categorical data into frequency tables and bar charts, then interpret the patterns in their real-world context.
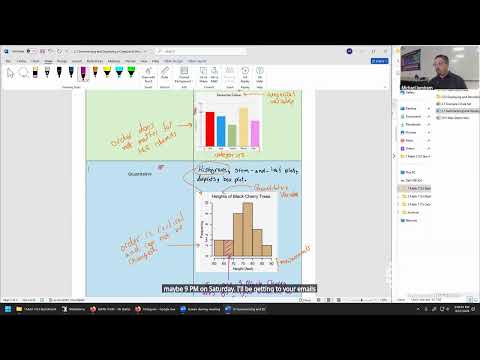
Math 1153 - 27 August 2026 - Chapter 1, Section 2.1
Classify variables by whether they represent categories or meaningful numerical measurements, then choose displays that match.
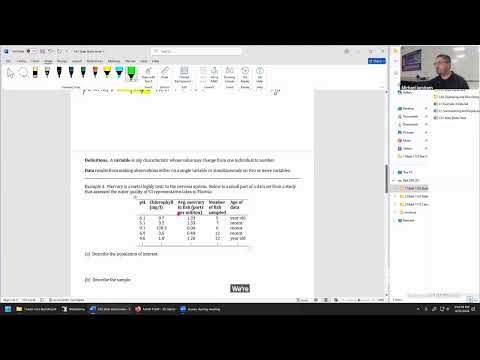
Math 1153 - 25 August 2026 - Ch1
Chapter 1 establishes how samples and statistics help estimate unknown population characteristics—and why estimates need a margin of error.
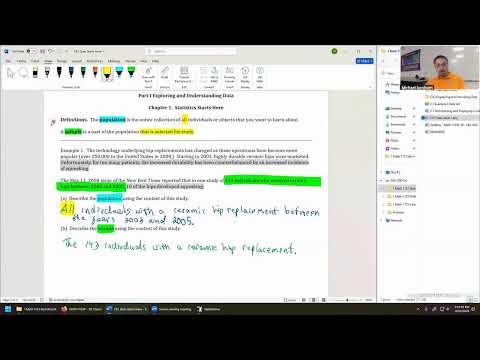
Math 1153 - 24 August 2026 - Introduction, Chapter 1
Statistics begins by distinguishing the population a study aims to understand from the sample it actually measures.
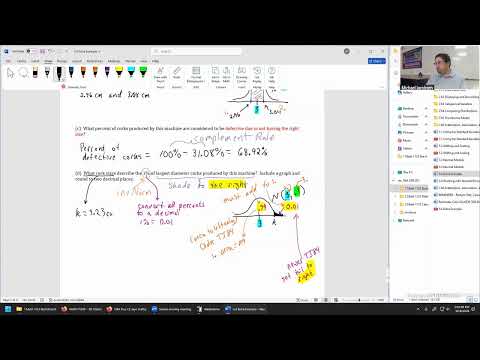
Math 1153 - 8 October 2026 - Section 5.4, Chapter 6
TI-84 normal-distribution methods find probabilities and percentiles for snowfall and cork diameters.