Math 1153 - 22 September 2026 - Ch3
 Watch on YouTube →
Overview
Mike Jacobsen analyzes a 626-person University of Texas Southwestern Medical Center study of tattoo history and hepatitis C using a two-way table, marginal and conditional distributions, and row- and column-percentage displays. The percentages show a strong association—hepatitis C prevalence is 22.1% among participants with tattoos versus 4.3% among those without—but the observational study cannot establish that tattoos cause hepatitis C; Jacobsen then previews box plots and five-number summaries for Chapter 4.
Key takeaways
- In the 626-person study, hepatitis C prevalence was 22.1% among participants with tattoos (25/113), compared with 4.3% among those without tattoos (22/513).
- The overall hepatitis C rate of 7.5% differs from the subgroup rates, illustrating why conditional percentages can reveal relationships hidden by marginal totals.
- For a percentage involving multiple categories, combine the relevant counts and group the numerator with parentheses—for example, (52 + 61)/626 × 100 = 18.1%.
- Row percentages compare hepatitis C outcomes within tattoo groups; column percentages compare tattoo status within hepatitis C groups, and both are valid when interpreted with the correct denominator.
- The table supports an association between tattoo status and hepatitis C, not a causal claim, because the researchers observed and interviewed participants rather than conducting a controlled experiment.
- A box plot summarizes quantitative data through the minimum, Q1, median, Q3, and maximum; the interquartile range is calculated as Q3 − Q1.
Chapters
0:00
Week 5 Logistics and the Three-Exam Course Schedule
- Mike Jacobsen notes that Monday was reserved for the first exam and says grading and Canvas feedback will begin after quiz grading.
- The course has three exams plus a final, with the next exam planned for week 9 rather than midterm week.
- Chapter 3 focuses on relationships between two categorical variables.
2:25
Tattoo and Hepatitis C Counts in the Southwestern Study
- A University of Texas Southwestern Medical Center study examines whether hepatitis C is associated with having tattoos and where they were obtained.
- The 626 participants are classified by tattoo status in rows and hepatitis C status in columns.
- The table records 47 participants with hepatitis C and 579 without it.
5:20
Marginal Distributions Ignore the Other Variable
- The tattoo marginal distribution uses row totals: 52 parlor tattoos, 61 tattoos obtained elsewhere, and 513 participants with no tattoos.
- The hepatitis C marginal distribution uses column totals: 47 positive cases and 579 participants without hepatitis C.
- Each marginal distribution describes one variable alone, ignoring the other variable in the table.
7:00
Conditional Distributions Restrict the Study to a Group
- For the tattoo distribution given no hepatitis C, the relevant group is the 579 participants in the no-hepatitis-C column.
- Within that restricted group, the tattoo counts are 35 parlor, 53 elsewhere, and 491 no tattoos.
- A conditional distribution changes the denominator from all 626 participants to the count meeting the stated condition.
12:30
Percent Questions: Separate Whole-Study Counts from Cell Counts
- For the percentage of all participants with hepatitis C, use 47/626 × 100, which is 7.5%.
- For participants who both have hepatitis C and have no tattoos, use the single table cell 22/626 × 100, or 3.5%.
- A cell count represents two conditions at once, while a row or column total represents a broader group.
18:04
Add Multiple Tattoo Categories Before Dividing
- The percentage of all participants with tattoos combines the parlor and elsewhere row totals: (52 + 61)/626 × 100 = 18.1%.
- Jacobsen warns that a calculator evaluates 52 + 61/626 × 100 in the wrong order unless the numerator is parenthesized.
- Use parentheses or calculate 52 + 61 first, then divide by 626 and multiply by 100.
24:06
Compare Hepatitis C Rates Among Tattooed and Untattooed Participants
- Among the 113 participants with tattoos, 25 had hepatitis C: (17 + 8)/(52 + 61) × 100 = 22.1%.
- Among the 513 participants with no tattoos, 22 had hepatitis C: 22/513 × 100 = 4.3%.
- The overall rate is 7.5%, so the subgroup rates suggest a marked relationship between tattoo status and hepatitis C.
30:42
Build Row Percentages to Compare Tattoo Groups Fairly
- Row percentages use each tattoo category's row total as the denominator, making every row sum to 100%.
- Among participants with parlor tattoos, 17/52 = 32.7% had hepatitis C and 67.3% did not.
- Among participants tattooed elsewhere, 8/61 = 13.1% had hepatitis C and 86.9% did not.
- Jacobsen notes that the 100% total lets students find one row percentage by subtracting the other from 100%.
38:30
Complete the Row-Percentage Display and Read Its Conditional Rates
- For participants with no tattoos, 22/513 = 4.3% had hepatitis C and 95.7% did not.
- The overall row is 7.5% with hepatitis C and 92.5% without it, based on 47/626 and 579/626.
- Each row percentage describes the hepatitis C distribution within a particular tattoo group.
43:34
Column Percentages Reverse the Comparison
- Column percentages use hepatitis C outcomes as the groups and describe tattoo status within each outcome.
- Among hepatitis C cases, 36.2% had parlor tattoos, 17.0% had tattoos obtained elsewhere, and 46.8% had no tattoos.
- Among participants without hepatitis C, 6.0% had parlor tattoos, 9.2% had tattoos obtained elsewhere, and 84.8% had no tattoos.
- Either row or column percentages can be used; the choice depends on which comparison best answers the research question.
52:50
Association Is Not Causation: Assessing Dependence
- The different tattoo distributions across hepatitis C outcomes indicate that the two categorical variables are associated, or dependent.
- Independence would mean the distribution of tattoo status stayed roughly the same for hepatitis C-positive and hepatitis C-negative groups.
- Because researchers interviewed participants rather than controlling an experiment, the data cannot establish that tattoos cause hepatitis C.
59:52
Chapter 4 Preview: Comparing Quantitative and Categorical Variables
- Chapter 4 will compare a quantitative measure of lung strength with categorical groupings such as age or smoking status.
- Jacobsen introduces the box plot, also called a box-and-whisker display, as a tool for comparing distributions across groups.
- The five-number summary and an outlier rule will underpin the upcoming box-plot work.
1:02:57
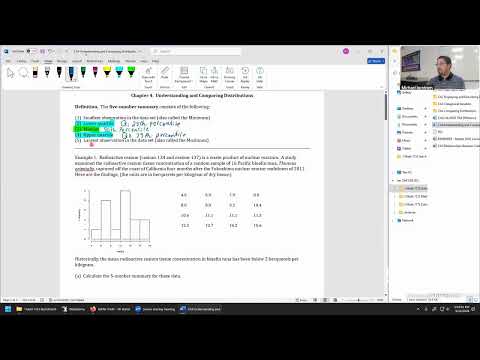
Five-Number Summary Preview with Radioactive Tuna Data
- A five-number summary consists of the minimum, lower quartile Q1, median, upper quartile Q3, and maximum.
- Q1, the median, and Q3 correspond to the 25th, 50th, and 75th percentiles; the interquartile range is Q3 − Q1.
- For the radioactive tuna dataset, the sorted observations show a minimum of 4.6 and a maximum of 15.6 becquerels per kilogram.
- Jacobsen postpones importing the data and calculating the remaining summary values until the next class; Quiz 3 is due then and Quiz 4 will be posted.
Summary, takeaways, and chapters were generated by AI from the video's transcript and may contain errors. The video belongs to its creator, Mike Jacobsen.