Math 1153 - 25 August 2026 - Ch1
 Watch on YouTube →
Overview
Mike Jacobsen introduces Math 1153’s Chapter 1 by showing students how to access Pearson MyLab homework and explaining why a TI-84 Plus is recommended over the TI-30 XS for later statistical probability work. He develops the course’s central distinction between populations, samples, parameters, and statistics using ceramic hip replacements, then practices interpreting study context through the five W’s and variables in a blindfolded-walking study.
Key takeaways
- In the ceramic-hip example, the population is everyone who received a ceramic hip from 2003–2005, while the sample is the 143 people contacted by the New York Times study.
- For the hip-squeaking data, 10 of 143 sampled individuals gives p-hat = 10/143 ≈ 0.0699, or 6.99%; this statistic estimates the unknown population parameter p.
- A sample estimate alone does not show how dependable it is: statistical inference must also quantify uncertainty, including a margin of error.
- Andrea Axtell’s blindfolded-walking study measured five variables—sex, height, handedness, distance walked, and direction of veering—among 32 participants.
- Study context determines what conclusions are justified: the walking study’s population is people able to walk normally, while its sample is only the 32 tested participants.
- Pearson MyLab saves homework progress automatically and permits repeated attempts; Jacobsen recommends treating its 15% of the course grade as practice for quizzes and exams rather than answer-guessing.
Chapters
0:00
Calculator Guidance and Course Setup
- Mike Jacobsen says the TI-30 XS lacks normal- and t-probability functions needed later in Math 1153.
- He recommends the TI-84 Plus because it is standard in statistics classes and the calculator he will demonstrate.
- Canvas links provide earlier announcements, recorded lectures, and access to Pearson MyLab.
3:50
Opening Chapter 1 Homework in Pearson MyLab
- A direct Canvas link under the section notes opens the Chapter 1 assignment without navigating through the textbook.
- Pearson MyLab saves answers automatically, so students can stop and resume without finishing the set in one session.
- Many early homework questions are multiple choice and focus on foundational vocabulary.
10:50
Homework Practice, Help Tools, and the September 3 Deadline
- Homework counts for 15% of the course grade and allows repeated attempts; Jacobsen emphasizes learning the concepts instead of guessing through choices.
- Pearson’s textbook link opens the relevant reading, while “Ask My Instructor” sends Jacobsen an email about a specific question.
- Chapter 1 homework is due September 3, one week after the planned Thursday completion; students may wait to begin or work ahead.
13:00
Ceramic Hip Replacements: Identifying the Population and Sample
- The study population is everyone who received a ceramic hip replacement between 2003 and 2005.
- A May 2008 New York Times study contacted 143 people from that population, forming its sample.
- The example sets up the course’s central task: use sample evidence to learn about a larger population.
16:05
Parameters and Statistics in the Hip-Squeaking Study
- The parameter p is the unknown population proportion of ceramic hips that squeak.
- The sample size is written n; here n = 143, referring to the number of individuals studied.
- The statistic p-hat is the sample proportion used to estimate the population parameter.
22:10
Calculating the Sample Proportion: 10 of 143 Hips
- Ten of the 143 sampled individuals reported squeaking hips, so p-hat = 10/143.
- The sample proportion is approximately 0.0699, or 6.99% when expressed as a percentage.
- The study uses the sample result to estimate that about 6.99% of the target population had squeaking hips.
26:20
Why a Statistical Estimate Needs a Margin of Error
- A point estimate such as p ≈ 6.99% is incomplete unless its reliability is described.
- The margin of error indicates how far the estimate may be from the true population proportion.
- Jacobsen previews probability calculations and later calculator work as tools for quantifying estimate accuracy.
30:10
Data, Context, and the Five W’s and How
- Data can include numbers, characters, images, or other identifying information, but it needs context to be meaningful.
- The five W’s and how ask who was measured, what was measured, how, where, when, and why the study was conducted.
- The study’s research question explains why its data were collected and what conclusions the analysis should address.
34:30
Andrea Axtell’s Blindfolded Football-Field Study
- Researcher Andrea Axtell tested 32 people to examine whether people naturally walk in circles without visual cues.
- Participants started at the center of one football-field goal line, were blindfolded, and tried to reach the opposite goal line.
- A football field is about 120 yards long, yet none of the 32 participants reached the far end before crossing a sideline.
37:46
Who Was Studied—and What That Implies About the Population
- The sample consisted of 32 people who could walk normally; describing them as blindfolded participants adds useful detail.
- The study’s setup implies that very young children and people unable to walk normally are not represented.
- Jacobsen recommends visualizing the study as it happened to identify relevant details in its context.
43:11
Five Measured Variables in the Walking Study
- A variable is a characteristic whose value may differ from one participant to another.
- Axtell recorded sex, height, handedness, the number of yards walked before going out of bounds, and whether participants veered left or right.
- Jacobsen notes that concise paraphrases such as “number of yards” can communicate a measured variable without rewriting the full study description.
47:11
How and Where the Blindfolded Study Was Conducted
- The “how” includes testing participants on a football field and blindfolding them before they attempted to walk.
- The context does not identify which football field or even which country hosted the study, so the precise location is unknown.
- Location could matter: factors such as altitude may affect how results generalize to other settings.
51:12
Dating the Study and Stating Its Research Question
- The source cites Stats journal, issue 39, Winter 2004; this establishes publication timing, not necessarily when the experiment occurred.
- The study was conducted on or before Winter 2004, and Jacobsen cautions that older findings may be less applicable when conditions or technology change.
- The research question was whether people naturally walk in circles in the absence of visual cues.
57:21
Defining the Walking Study’s Sample and Population
- The sample is the 32 participants tested while blindfolded and instructed to walk across the field.
- The population of interest is all people able to walk normally, not only people who have become lost.
- The sample is a practical subset intended to support conclusions about a much larger population, so representativeness matters.
1:02:41
Variables and a Preview of the Florida Lakes Example
- Study data result from collecting observations on one or more variables; the walking study measured five characteristics across 32 participants.
- Jacobsen says he will upload class notes with the day’s completed edits and solutions after class.
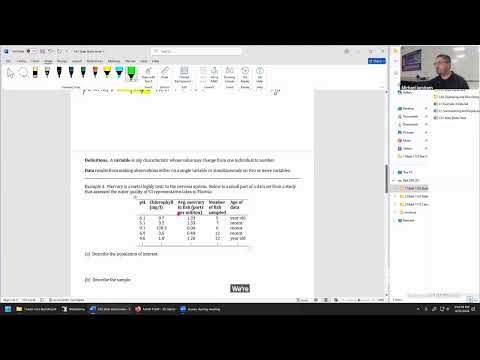
- In the next example, 53 representative Florida lakes indicate the sample, while all lakes in Florida are the population; later material will classify variables as categorical or quantitative.
Summary, takeaways, and chapters were generated by AI from the video's transcript and may contain errors. The video belongs to its creator, Mike Jacobsen.