Math 1153 - 10 September 2026 - Sections 2.4
 Watch on YouTube →
Overview
Mike Jacobsen introduces Section 2.4 on measuring the center of quantitative data, explaining the sample mean and median and showing how to calculate them with a TI-84. Using 20 restaurant-tip percentages, he finds a mean of 27.315% and a median of 21%, then connects the gap to right skew and outliers while troubleshooting calculator setup and model-specific behavior.
Key takeaways
- The sample mean is computed as Σyᵢ/n; for the 20 restaurant-tip observations, the TI-84 returned a mean of 27.315% and a median of 21%.
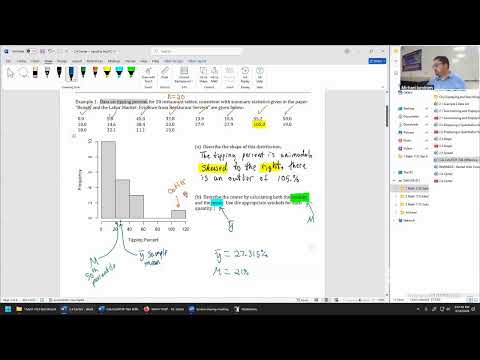
- The tip distribution is unimodal and right-skewed, with a main cluster below 40% and an upper-end outlier at 105%; the right tail pulls the mean above the median.
- The median is the 50th percentile: with 20 observations and a median of 21%, 10 tables tipped less and 10 tipped more.
- On a TI-84, enter observations in L1, choose STAT → Calculate → 1-Var Stats, leave Frequency List blank, and inspect X̄ for the mean and MD for the median.
- For TI-84 versions that show only a 1-Var Stats prompt, insert L1 with 2nd + 1; on the TI-84 EVO, pressing ZOOM may be needed to trigger the calculation.
- When a distribution is strongly skewed, the median is typically more resistant and representative of the main cluster than the mean, which moves in the direction of the skew.
Chapters
0:00
Quiz Deadline, Exam Scheduling, and Week-Five Plans
- Quiz 1 is considered on time if submitted any time on September 10, despite the Canvas deadline showing 1:00.
- Mike Jacobsen plans to post Exam 1 sections and review problems on Friday; quizzes and homework are intended as exam preparation.
- Students will receive individual Canvas instructions Sunday evening for scheduling Exam 1, which may be taken Monday through Thursday.
- There is no class on the exam Monday, giving students a breather and allowing them to take the exam during the usual class period.
7:08
Mean, Median, and the Sample-Mean Formula
- Center describes a typical observation in a quantitative dataset; the histogram example suggests a typical synovial-fluid pH near 7.2–7.3.
- The sample mean, written y-bar in the course text, is the sum of all observations divided by sample size n.
- The summation symbol Σ means to add observations y₁ through yₙ; for data 3, 5, and 7, the sample mean is 5.
- Use the median, the 50th percentile, when strong skew makes the mean a less representative description of center.
11:06
Restaurant Tips: Right Skew, Unimodality, and Outliers
- The example contains 20 quantitative restaurant-tip percentages, constructed to match summary statistics from a real labor-market study of restaurant servers.
- Ten of the 20 tables tipped between 0% and 20%, forming the dataset’s single main peak and making the distribution unimodal.
- The distribution is skewed to the right, with unusual observations at 55.2% and 105%; the 105% tip is an upper-end outlier.
- When describing a distribution’s shape, report modality, skew direction, and any outlier with its approximate location.
17:17
TI-84 Setup: Restoring the Statistics List Editor
- Press STAT and then ENTER to open the list editor, which should display L1, L2, and L3.
- If L1 is missing or the editor starts at a later list such as L5, use STAT, select option 5 (SetUpEditor), press ENTER twice, then reopen the editor.
- Restoring L1 matters because the one-variable statistics command defaults to that list.
- The class will enter this example’s data in L1; later work may use both L1 and L2.
22:09
Clearing Old Data from TI-84 Lists
- Existing values can be removed one at a time with DELETE, but clearing an entire list is faster for a long dataset.
- Highlight the list name, such as L1, press CLEAR, and then ENTER to erase its contents.
- Do not press CLEAR while highlighting the list column itself; clear the list by selecting its L1 heading.
- Check that the list is empty before entering the restaurant-tip observations.
25:18
Navigating Lists and Troubleshooting the TI-84 Editor
- The list editor scrolls horizontally between L1, L2, and later lists, and vertically through observations.
- If L1 is not visible, restore the editor with STAT → SetUpEditor or use the left-arrow key to scroll back.
- Mike Jacobsen encourages students to share calculator model details or photos of errors so he can troubleshoot TI-84 and other brands.
- Practicing with the same calculator intended for quizzes and exams helps make the keystrokes familiar.
31:37
Entering 20 Tip Percentages and Verifying the Sample Size
- Enter each restaurant-tip percentage into L1 carefully; column-by-column entry and checking off values help prevent transcription mistakes.
- A small input error, such as entering 27.8 instead of 27.9, can change the result and cause an online homework answer to be marked incorrect.
- The 20-table context requires exactly 20 observations: the next cell should be L1(21), while the final entered value should appear at L1(20).
- Check the observation count to catch a skipped or duplicated value before calculating statistics.
38:26
Running One-Variable Statistics on L1
- After data entry, press STAT again and use the right arrow to move from Edit to Calculate.
- Select option 1, 1-Var Stats, which computes summary statistics for one quantitative variable.
- Confirm the list is L1 and leave the frequency-list field blank before pressing ENTER to run the calculation.
- If the menu instead shows Z Test, move back to the statistics menu tab before selecting 1-Var Stats.
41:35
TI-84 Menu Differences and Entering L1 Manually
- Some TI-84 Plus versions show a simplified 1-Var Stats prompt without visible List and Frequency List fields.
- For that interface, press 2nd and then 1 to insert L1 manually, then press ENTER to calculate.
- The TI-84 Plus interface changed across versions, so identical model names may not produce identical prompts.
- If the output differs from the class example, verify that the same 20 values were entered in L1.
50:37
Troubleshooting the TI-84 EVO Calculation Screen
- A student using a TI-84 EVO reported that 1-Var Stats remained on the Calculate screen instead of advancing to the results.
- Mike Jacobsen did not initially know the fix and planned to investigate the new model’s behavior.
- A later class report found that pressing the ZOOM key prompted the EVO to compute the statistics.
- Testing the calculator used for homework and quizzes also prepares students to use that same device during exams.
55:57
Reading the TI-84 Output: Mean and Median
- The calculator labels the sample mean X̄, while the course text uses y-bar; both symbols refer to the sample mean.
- For the 20 tip percentages, the sample mean is 27.315%.
- Scroll down through the output to find MD, the calculator’s label for the sample median, which is 21%.
- The output also reports sample size n = 20, minimum 0%, and maximum 105%, alongside quartiles.
1:00:49
Interpreting the 27.315% Mean and 21% Median
- The median of 21% is the 50th percentile: 10 tables tipped less and 10 tipped more.
- The median lies near the distribution’s main cluster, while the right-skewed tail pulls the mean up to 27.315%.
- For strongly right-skewed measures such as incomes or housing prices, the median often better represents a typical value than the mean.
- The mean follows the direction of skew, and increasingly extreme outliers can move it farther from the center of the main data cluster.
1:04:19
Choosing a Center Measure and Preparing for Quiz 2
- For roughly symmetric data, the mean and median are generally closer; with noticeable skew, the median is usually the more resistant measure of center.
- The class will compare symmetric, left-skewed, and right-skewed distributions in the next discussion of choosing a center statistic.
- Mike Jacobsen recommends practicing the TI-84 workflow in homework and Quiz 2, due September 17.
- Students can contact him about calculator problems, including unfamiliar TI-84 models, while preparing for Exam 1.
Summary, takeaways, and chapters were generated by AI from the video's transcript and may contain errors. The video belongs to its creator, Mike Jacobsen.