Math 1153 - 3 November 2026 - Section 13.3
 Watch on YouTube →
Overview
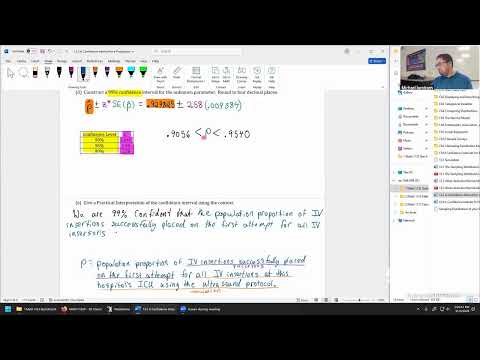
Mike Jacobsen walks through two full confidence-interval analyses for population proportions, from identifying the parameter and checking conditions to calculating bounds and interpreting them in context. For 143 ceramic hip replacements with 10 squeaking hips, the 95% interval is 0.0281 to 0.1117; for 741 ICU IV insertions with 689 successful first attempts under an ultrasound protocol, the 99% interval is 0.9056 to 0.9540.
Key takeaways
- A confidence interval for a population proportion has the form p-hat ± z-star × SE(p-hat), where SE(p-hat) = sqrt[p-hat(1 − p-hat)/n].
- The ceramic hip sample produced p-hat = 10/143 = 0.069930 and a 95% interval of 0.0281 to 0.1117, assuming the sample is representative.
- For a proportion interval, the success-failure check requires at least 10 successes and 10 failures; the hip study passes with 10 squeaking hips and 133 non-squeaking hips.
- A 95% confidence level means that about 95% of intervals from repeated samples using the same procedure are expected to contain the fixed population proportion.
- The ICU audit's 689 first-attempt successes among 741 IV insertions yield a 99% interval of 0.9056 to 0.9540 for the protocol's population success proportion.
- Correctly defining the parameter requires both the outcome and population: the ICU parameter concerns first-attempt IV placement specifically at that hospital's ICU while using its ultrasound protocol.
Chapters
- For categorical two-outcome data, estimate population proportion P with sample proportion p-hat; for quantitative data, estimate population mean mu with sample mean y-bar.
- Both interval formulas combine an estimate, a critical value, and a standard error; proportion intervals use z-star.
- The product of z-star and the standard error is the margin of error.
- The study reports 10 squeaking hips among 143 ceramic hip replacements, giving p-hat = 10/143 = 0.069930.
- The standard error formula is the square root of p-hat times (1 minus p-hat), divided by n.
- Substituting 0.069930 and n = 143 gives a standard error of approximately 0.021327.
- Jacobsen recommends writing the formula and substitutions before using a calculator to preserve exam partial credit and reduce input errors.
- The article does not explain how the 143 patients were selected, so randomization cannot be confirmed.
- The sample is considered unlikely to exceed 10% of the population, given the large number of hip replacements performed.
- The 10% condition is therefore treated as met, while representativeness remains an important uncertainty.
- A proportion interval requires at least 10 successes and 10 failures for the normal approximation.
- The hip study has exactly 10 squeaking hips and 133 non-squeaking hips, so both thresholds are met.
- Overall, the conditions are considered satisfied only if the study's sample was random or representative.
- The 95% interval uses p-hat plus or minus z-star times the standard error, with z-star = 1.96.
- Substituting p-hat = 0.069930 and standard error = 0.021327 produces bounds of approximately 0.0281 and 0.1117.
- The interval estimates the population proportion of ceramic hips that squeak, not the proportion in the sample.
- The margin of error is z-star times the standard error: 1.96 × 0.021327, or about 0.0418.
- The sample estimate is 0.069930, and adding or subtracting 0.0418 gives the interval from 0.0281 to 0.1117.
- The margin of error expresses uncertainty around the single sample estimate, while the interval shows the corresponding range.
- A 95% confidence level describes the success rate of the sampling-and-interval procedure, not a 95% probability that this particular fixed interval contains P.
- Across 100 repeated studies with the same sample size, about 95 resulting intervals are expected to contain the true population proportion.
- Increasing confidence to 99% raises the critical value and widens the interval, trading precision for greater long-run coverage.
- Reporting the confidence level is essential: a narrower interval made with a lower confidence level should not be presented without disclosure.
- The conclusion identifies P as the proportion of patients receiving ceramic hips during 2003 to 2005 whose hips squeak.
- With 95% confidence, that population proportion is between 0.0281 and 0.1117, or about 2.81% to 11.17%.
- Jacobsen emphasizes restating the parameter in plain language so the numerical interval is meaningful to a non-statistical audience.
- The second study concerns a nurse-driven ultrasound and vein-assessment protocol intended to help nurses place peripheral IV catheters on the first attempt.
- A random audit sample contains 741 IV insertions, of which 689 were successfully placed on the first attempt.
- The success is a first-attempt placement; an unsuccessful first attempt is the alternative outcome.
- Because each IV insertion is classified as a first-attempt success or failure, the data are categorical and the parameter is a population proportion P.
- P describes the proportion of IV insertions successfully placed on the first attempt, not an average measurement.
- The target population is all IV insertions in the hospital's ICU using the ultrasound protocol, rather than all IV insertions everywhere.
- The sample proportion is 689/741 = 0.929825, meaning about 92.98% of sampled insertions succeeded on the first attempt.
- Substituting p-hat = 0.929825 and n = 741 into the proportion standard-error formula gives approximately 0.009384.
- The relatively large sample of 741 makes the standard error small, which supports a narrower interval.
- The 99% confidence interval uses z-star = 2.58, p-hat = 0.929825, and standard error = 0.009384.
- The calculated bounds are 0.9056 and 0.9540, rounded to four decimal places.
- The interval places the ICU protocol's population first-attempt success proportion between 90.56% and 95.40%.
- The contextual conclusion is that the first-attempt success proportion for IV insertions in this ICU using its ultrasound protocol is between 90.56% and 95.40%, with 99% confidence.
- Writing the population parameter carefully before calculating makes the final interpretation more accurate, even when the context requires a long description.
- The next class will finish the notes and adapt the same general interval approach to quantitative data and population means.
Transcript excerpt
0:54 Okay, looks like we can start. Welcome back everyone. We're getting into some of the more exciting material as the doodles on the canvas screen here kind of shows. We're about to start our full confidence interval analysis top to bottom. And we have two examples that we're going to go through in this section here. Then we're going to change over to doing confidence intervals for means looking into quantitative data. And we take a look to the right. It's kind of remarkable how similar our formulas are. On the left in black, the parameter is P if the data is categorical, two outcomes specifically. And the parameter is going to be mu, the mean of the population, if it's quantitative. In both cases, we have a really good estimate that represents one
1:43 single number. For categorical, we use a population, excuse me, the sample proportion of successes, P hat on the left. Over here, for quantitative, we use the sample mean Y bar that we've been calculating quite a lot to the here to approximate the parameter to the left as well. But both these estimates we've mentioned quite a lot are not useful until we can say what is the error in that measurement. What's the margin of error? And that's what these confidence intervals provide. The formulas are again remarkably similar. We put in the statistic P hat for categorical or we use Y bar to start off. If it's quantitative, then we add or subtract some critical number. In the quantitative case, it's TAR. In the
2:32 categorical case, it's ZAR. And then we just use the appropriate standard error formula. So that's where we're at so far. We're going to look into these formulas again, break them down, and see how to make our strong conclusions at
This is the start of the transcript. Save this video free for the whole transcript, searchable and time-coded.
Related notes
Summary, takeaways, and chapters were generated by AI from the video's transcript and may contain errors. The video belongs to its creator, Mike Jacobsen.