L20 Energy Use During Exercise II
Overview
Dr. Chris Black explains how exercise intensity and duration shift fuel use, then connects those changes to VO2 max, endurance, and exercise-test interpretation. Key distinctions include fat percentage versus total fat burned, the marathon “wall” as muscle glycogen depletion, absolute versus body-weight-relative VO2, and the difference between a VO2 max and a modality-specific VO2 peak.
Key takeaways
- A larger percentage of energy from fat does not necessarily mean more fat burned: total fat use per hour can be higher at moderate intensity because total energy expenditure is much greater.
- At a steady submaximal intensity, prolonged exercise shifts fuel use away from muscle glycogen and toward fat; marathon muscle-glycogen depletion around miles 16 to 18 can contribute to hitting the wall.
- VO2 max reflects multiple systems, including lungs, circulation, cardiac output, capillary delivery, and muscle oxidative capacity, rather than mitochondrial function alone.
- Relative VO2 max divides oxygen consumption in milliliters per minute by body mass in kilograms; extra nonfunctional mass can lower the score even when absolute VO2 and muscle capacity are unchanged.
- VO2 max is most useful for comparing people with substantially different fitness levels; among similarly trained endurance athletes, lactate-threshold work rate may better predict race performance.
- A plateau in oxygen consumption during rising work rate is the strongest evidence of VO2 max; lactate near 8 mmol/L, RER above 1.1, and high age-predicted heart-rate attainment are secondary effort checks.
Chapters
- At roughly 25% of VO2 max, more than 80% of energy in the example comes from fat, particularly plasma free fatty acids.
- As intensity rises toward 65% and 85% of VO2 max, carbohydrate supplies more energy and muscle glycogen contributes a larger share.
- Muscle glycogen provides a small energetic advantage over blood glucose because it bypasses the ATP-consuming hexokinase step, yielding about 32 rather than 30 ATP per glucose equivalent.
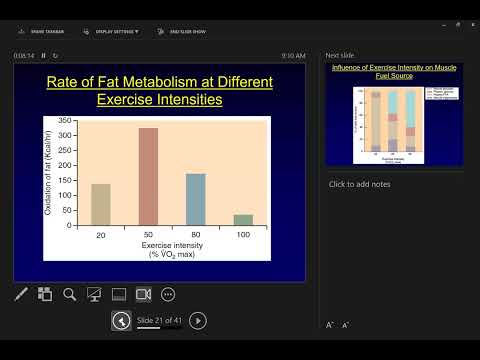
- A high percentage of calories from fat at 20% to 25% of VO2 max does not mean the greatest total fat use per hour.
- The example shows absolute fat metabolism is higher around 50% to 80% of VO2 max, because total energy expenditure increases enough to outweigh the lower fat percentage.
- Black cautions against choosing very slow treadmill walking solely because its calories come mostly from fat; total expenditure matters when comparing fat burned over time.
- During four hours at a steady submaximal intensity near 60% of VO2 max, muscle glycogen use declines while blood glucose use rises and overall carbohydrate use falls.
- As the bout continues, the body relies more heavily on fat, especially plasma free fatty acids; fat is used throughout exercise, not only after 45 minutes.
- Around miles 16 to 18 of a marathon, muscle glycogen may be depleted, contributing to the fatigue known as hitting the wall even though blood glucose and fat remain available.
- Long runs can prepare marathoners psychologically for glycogen depletion, although Black says extending workouts beyond roughly 35 to 40 minutes is not necessary solely to increase VO2 max.
- VO2 max is the highest attainable oxygen consumption and the fastest rate of aerobic ATP production through the Krebs cycle and electron transport chain.
- The clearest indicator is a plateau in oxygen consumption despite increased work rate, such as faster treadmill running or greater bike resistance.
- VO2 max integrates lung oxygen uptake, cardiac output, heart rate, stroke volume, blood flow, capillaries, and muscle oxidative capacity.
- Black describes VO2 max as a strong indicator of cardiorespiratory fitness and health outcomes, and explains that clinical stress tests raise cardiac workload to assess circulation and detect problems.
- When two people differ substantially in fitness, the person with the higher VO2 max is generally favored in an endurance race.
- Among similarly trained athletes, VO2 max alone is a weaker predictor because values cluster; work rate at lactate threshold can better distinguish endurance performance.
- Absolute VO2 max is measured in liters per minute, while relative VO2 max converts liters to milliliters and divides by body mass in kilograms.
- Relative VO2, reported in mL/kg/min, helps compare people of different sizes, but body-weight division does not remove every difference related to muscle mass or body composition.
- Black identifies age, sex, aerobic training, muscle mass, body weight, and genetics as major influences; genetics accounts for about 40% of VO2 max variation.
- Age affects cardiac output partly through age-predicted maximum heart rate, while training changes factors such as mitochondrial content, capillaries, and heart size.
- Extra non-force-producing body mass lowers relative VO2: Black compares a 150-pound person and a 200-pound person with the same 3 L/min absolute VO2, yielding about 44 versus 33 mL/kg/min.
- The 50-pound difference is likened to carrying a backpack while running, increasing the load without adding muscle or ATP-generating capacity.
- Black gives approximate college-age averages of the low-to-mid 40s through 50 mL/kg/min for men and the high 30s through low 40s for women.
- Elite male distance runners may reach the mid-70s to 80s; the lecture cites a cyclist near 97 mL/kg/min and collegiate runners averaging about 76 for men and 68 for women.
- Treadmill VO2 values are commonly 5% to 10% higher than cycling values in most people, partly because running recruits arm movement and more total activity.
- Arm-crank VO2 peak is typically about two-thirds to three-quarters of leg-cycling values because the arms use less muscle mass and generate less force.
- Black reserves VO2 max for the highest attainable value and calls tests using other exercise modes VO2 peak, the highest value achieved in that particular activity.
- The class bike protocol therefore measured VO2 peak, which may be lower than a person's highest possible treadmill value.
- In an example, arm-crank VO2 peak was about 30 mL/kg/min compared with the low 40s during leg cycling, and peak heart rate was about 179 versus 186 beats per minute.
- Smaller active muscle mass can limit force and oxygen use, and may prevent cardiac output and heart rate from reaching the levels seen in a whole-body test.
- The strongest criterion for VO2 max is a plateau in oxygen consumption even as work rate increases.
- Secondary effort indicators include blood lactate near 8 mmol/L, respiratory exchange ratio above 1.1, and reaching at least 90% of age-predicted VO2.
- RER can exceed 1.0 because bicarbonate buffers hydrogen associated with lactate production, generating extra carbon dioxide that is exhaled.
- Other checks include perceived exertion of 19 to 20 and about 95% of age-predicted maximum heart rate; for a 20-year-old with a predicted maximum of 200 bpm, that target is about 190 bpm.
Transcript excerpt
0:01 Then we'll talk about max VO2, which you guys have done in lab. I may revisit a couple of things about lactate threshold, which you guys are going to cover in lab today and tomorrow. And then we may have some time at the very end to do a little bit of test questioning or something like that if you guys have have anything in that way. Friday we will do we'll do Jeopardy on Friday just like we did last time. We'll get into teams. Play for bonus points on the test and then the test will be next Monday. Okay? All right. So, Monday I finished by showing I don't know if this will go backwards. We finished by showing this particular graph. Okay? I'm going to show you the next graph in the next slide that's going to make you
0:48 question everything you've seen here. And there there's a lot more nuance than we can actually be understanding with with everything. So, what I should probably do I probably should show these graphs in the in the opposite order. So, when we when we go here, what this graph is trying to show you is an exercise intensity. So, 25% of VO2 max, so very very slow walk. 65% of VO2 max, so a pretty brisk jog. 85% of VO2 max, so we're jogging clearly we're running you know, very very near max. And let's imagine that let's say we did 10 minutes at each one of them. Okay? 10 minutes of exercise at each one of these. And then there is some total
1:37 amount of energy that we are expending across that 10 minutes. So, what this graph is trying to demonstrate to you is what is the fuel source? How much energy is coming from
This is the start of the transcript. Save this video free for the whole transcript, searchable and time-coded.
In this course
Related notes
Summary, takeaways, and chapters were generated by AI from the video's transcript and may contain errors. The video belongs to its creator, Exercise Physiology with Dr. Chris Black.