fnb100f260914a
Overview
Dr. Jeff Hong completes the ROI lesson by distinguishing arithmetic averages from geometric averages, deriving compound growth with a 10% CD example, and showing how to calculate returns with Excel functions such as PRODUCT, COUNT, and GEOMEAN. He then connects investment returns to macroeconomic interest rates, explaining nominal versus real rates, inflation's effect on purchasing power, and why borrowing and lending respond differently to interest rates; supplemental instructor Anna Karen also outlines free tutoring and study support.
Key takeaways
- For a $10,000 CD earning 10% annually, compounding produces about $25,937 after 10 years, compared with the incorrect $20,000 simple-interest estimate.
- The geometric average is the constant annual rate that reproduces cumulative growth; the arithmetic mean of time-series returns can overstate the true annualized rate because it ignores compounding.
- With interim cash flows, a geometric-return calculation must account for reinvestment assumptions; rental income reinvested at varying rates cannot be treated like principal compounding at one constant rate.
- In Excel, calculate the geometric average by applying PRODUCT to gross returns, raising the product to 1/COUNT of observations, then subtracting 1; GEOMEAN likewise requires gross returns and a final subtraction of 1.
- A 4% nominal CD rate with 3% inflation yields approximately a 1% real rate, while a 5% nominal return under 10% inflation can reduce purchasing power despite increasing the account balance in dollars.
- CAGR, or compounded annual growth rate, summarizes uneven investment growth as a single annualized rate and provides a bridge between asset-level ROI and macroeconomic interest-rate analysis.
Chapters
- Jeff Hong asks students to open the course spreadsheet from Brightspace and continue the exercise completed in the previous class.
- A previous classroom was not a computer lab, so students who did not bring laptops had to download and finish the work independently.
- Hong requests camera activation and green-check reactions as evidence of participation, and saves class screenshots.
- Dividing a house's total capital gain by 11 gives an average dollar gain per year, not its annual percentage growth rate.
- A simple arithmetic average of yearly growth rates is easy to calculate with SUM divided by COUNT or Excel's AVERAGE function.
- Hong warns that the arithmetic average overstates annualized growth because it ignores compounding.
- Hong uses a certificate of deposit, or CD, to explain how a constant annual interest rate represents compounded growth.
- A $10,000 deposit earning 10% annually provides a benchmark for checking whether an average growth rate reproduces the ending value.
- After one year, a $10,000 principal earns $1,000 in interest and becomes $11,000.
- Factoring principal plus interest gives the recurring growth factor P × (1 + r), with each year's balance becoming the next year's starting balance.
- The second year earns 10% on $11,000, producing $12,100 rather than $12,000 because interest compounds.
- Repeating the annual step yields the future-value formula FVₙ = P × (1 + r)ⁿ.
- For $10,000 at 10% over 10 years, the calculation is $10,000 × 1.1¹⁰, approximately $25,937.
- Hong contrasts the result with the incorrect simple-interest estimate of $20,000 to illustrate compounding.
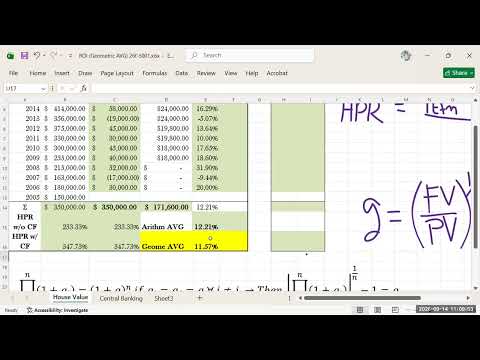
- Hong treats the CD's constant 10% growth rate as the geometric average return over the investment period.
- Applying the geometric average to the initial value and number of periods reproduces the ending value, unlike the arithmetic average.
- For the house example, the annualized geometric rate should turn the initial price into the final $500,000 value over 11 years.
- Cross-sectional data compare different subjects at the same time, such as the heights of students in one class.
- Time-series data track one subject across multiple periods, as with a house price or investment balance changing over time.
- Hong associates compounding with the time dependence in a series of returns, making geometric averages appropriate for annualized growth.
- In the rental-property scenario, annual return includes both the price change and rental income.
- Hong adjusts the spreadsheet's period difference to one year and calculates return using capital gain plus cash flow over the previous price.
- When an asset has no cash flow, as in the first scenario, its return and growth rate are the same; rental income makes the return larger.
- The simple initial-to-final-value geometric formula assumes that interim cash flows are reinvested at the same return as the original investment.
- Hong says this assumption is unlikely for rental income because owners may spend some cash flow or reinvest it at varying rates.
- Different reinvestment rates, such as 12%, 8%, 7%, or 5%, prevent treating all interim cash flows as though they compounded at one constant rate.
- The uppercase Greek letter Π denotes a product, meaning multiplication of each period's gross growth factor, (1 + gᵢ).
- The product of yearly gross returns, from (1 + g₁) through (1 + gₙ), represents cumulative growth across uneven periods.
- The geometric average is the constant rate that produces the same cumulative result; Hong postpones the fuller derivation to Module 3.
- Hong creates a column of gross growth rates by adding 1 to each net growth rate.
- He uses Excel's PRODUCT function on the gross-rate range, then raises the result to 1 divided by COUNT of the observations and subtracts 1.
- Using COUNT rather than visually counting rows makes the formula reliable for large datasets, including long time series.
- The spreadsheet's geometric average is approximately 16.34% when calculated from the gross returns.
- Excel's GEOMEAN function must receive gross returns, followed by subtracting 1 to convert the result back to a net return.
- Hong cautions against treating Excel as a black box: GEOMEAN on net returns, or on gross returns without subtracting 1, will not produce the intended net growth rate.
- He recommends using two monitors so students can watch a demonstration and reproduce it in Excel without switching away from the lesson.
- Anna Karen introduces herself as a supplemental instructor who previously took Finance 300 with Hong and supports students through peer tutoring.
- The free Learning Resource Center service offers small-group or individual sessions, practice problems, homework help, quiz and exam preparation, and study-skills support.
- Karen offers remote Zoom sessions, some in-person meetings, drop-in hours, scheduled sessions, and a WhatsApp group for common questions.
- She encourages students to attend throughout the semester rather than waiting until the day before an exam, and highlights vocabulary, time management, and understanding formulas.
- Hong summarizes the ROI material as a method for calculating investment returns, especially annualized returns.
- He names the annualized geometric average the compounded annual growth rate, or CAGR.
- CAGR expresses uneven period-by-period growth as one annual rate that captures compounding.
- The next course topic links investment returns at the firm or asset level to interest rates in the macroeconomy.
- Hong previews analyzing asset prices alongside unemployment, inflation, and real interest rates.
- The stated goal is to use macroeconomic signals of recession or boom to inform asset-management decisions.
- Hong says low interest rates can fuel economic activity, but only when they remain high enough relative to inflation.
- He contrasts the 10% CD example with much lower contemporary rates and describes Japan's benchmark rate as below 1% after decades of low rates.
- He identifies the Japanese yen carry trade as a mechanism supporting holdings of U.S. Treasury securities.
- Students estimate current CD rates at about 4% and inflation at roughly 3% to 3.6%; Hong uses 3% for a simple example.
- A 4% nominal CD rate minus 3% inflation gives an approximate 1% real interest rate.
- The nominal rate measures the stated dollar return, while the real rate adjusts that return for changes in prices.
- Hong illustrates real purchasing power with a bottle of Coke priced at $1 before 10% inflation and $1.10 afterward.
- A fixed $10,000 balance buys fewer physical goods after prices rise, even though the nominal dollar amount has not changed.
- A nominal return equal to inflation gives a real return near zero; a nominal rate below inflation produces a negative real return.
- At 5% interest, $10,000 becomes $10,500 in nominal dollars after one year.
- With 10% inflation, the $10,500 buys about 9,545 units of a good that cost $1 before inflation, illustrating a negative real return.
- Hong distinguishes a 3-percentage-point difference between a 6% interest rate and 3% inflation from a 100% relative increase in the rate.
- A lender benefits when the nominal interest rate exceeds inflation, while a borrower generally faces less favorable terms at higher rates.
- Hong ends the macroeconomics discussion before fully developing the borrower's perspective because another class is starting.
- He tells students the next Wednesday meeting will be online, notes that every second Wednesday is planned for in-person meetings, and asks students to read the Brightspace announcement.
Transcript excerpt
1:18 Hey, good morning everyone. Good morning. Happy Monday. Good morning. Good morning. I still see four people in the waiting room. Okay, I admitted I just submitted them all. Why is it still there? All right. I I Okay, I believe and I hope everyone has uh seen ah what's going on? I just admitted these two people. What's going on? Yes. >> Okay. So, uh first of all, I want you to um open this file, right? You know which file I'm talking about. Hey people still there.
2:09 I just did. Come on. I just did. All right. So last Wednesday and that was uh unfortunately uh the room assigned classroom was not a computer lab. So you probably didn't get a chance to uh download this unless you brought your uh unless you had brought your laptop with you. Uh so today I need you to download and um you should have actually after the class last Wednesday, you should have actually uh worked out the exercise we did last time
2:58 because by now you should have this uh already filled in up to this point, right? I mean uh up to this because we don't have time to redo this all over again. We lost already one day uh we lost we're already one day behind uh one:00 class. Remember I have on Monday, Monday, Wednesday I have 11:00 class which is yours. there was you know one o'clock class and one o'clock class fortunately it was a uh computer lab but you know uh not not very fortunately for me the
3:47 the instructor station was not uh touchscreen >> so um that that room also has a you know some limitations but at least the students could download the uh uh file and that work worked you know on the
This is the start of the transcript. Save this video free for the whole transcript, searchable and time-coded.
In this course
Related notes
Summary, takeaways, and chapters were generated by AI from the video's transcript and may contain errors. The video belongs to its creator, Jeff Hunk.