fnb100f260908
Overview
Jeff Hong uses an Excel housing-investment exercise comparing a 2005 to 2016, 11-year holding period to explain why arithmetic average returns overstate performance when returns compound. He derives geometric-average formulas for investments with and without rental cash flows, demonstrates Excel functions such as COUNT, PRODUCT, and GEOMEAN, and reports a 16.34% geometric average for the cash-flow scenario.
Key takeaways
- For an investment whose value compounds over multiple years, the geometric average, calculated as (ending value divided by starting value) raised to 1/n and minus one, is the annual rate that reproduces the actual endpoint.
- Dividing an 11-year total return by 11 is not an annual average, and even the arithmetic average of yearly returns can overstate performance because it ignores compounding.
- When rental income is present, annual total return includes both capital gain and cash flow: (next-period value minus current value plus cash flow) divided by current value.
- To calculate geometric returns with Excel's GEOMEAN, use gross return factors of 1 + r and subtract one from the result; applying GEOMEAN directly to net returns gives the wrong calculation.
- Excel's PRODUCT and COUNT functions can implement the general geometric-average formula by multiplying annual gross factors and using the number of observations as the exponent denominator.
- The subprime mortgage example shows how adjustable-rate defaults can trigger foreclosures, increase housing supply, depress resale prices, and prevent banks from recovering loans funded by depositor money.
Chapters
- Jeff Hong asks students to reopen the Excel file used in the previous Thursday session.
- Students confirm they have the workbook using green check marks and prepare to continue the 2005 to 2016 housing example.
- The total capital gain for the 11-year holding period can be calculated as the 2016 house value minus the 2005 value, or by summing annual capital gains.
- Scenario one treats the house as a home with no rental income; scenario two includes rental cash flows.
- Excel formulas lock the initial investment cell, such as B13, so it does not shift when copied across columns.
- Dividing the 233% holding-period return by 11 does not produce the average annual growth rate.
- An arithmetic average requires summing annual growth rates and dividing by the number of observations, but still fails to account for compounding.
- The example's simple average of about 12.21% is presented as overstated relative to the compounded average.
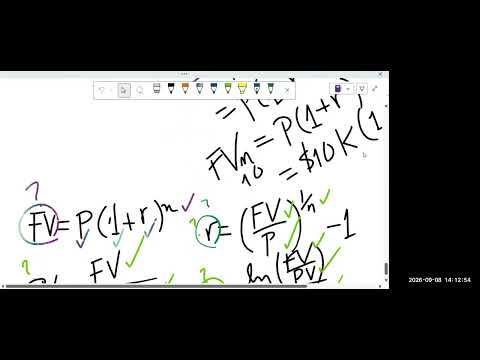
- The future-value relationship is principal multiplied by (1 + r) raised to n, where r is the annual rate and n is the number of years.
- A $10,000 deposit earning 10% annually for 10 years illustrates how interest earns further interest.
- Jeff Hong compares compounding to a snowball effect, with each year's balance becoming the base for the next year's growth.
- Jeff Hong contrasts fixed-rate borrowing with adjustable-rate loans, noting that borrowers with strong credit can often negotiate lower fixed rates.
- A bank deposit makes the saver a lender and the bank a borrower; banks then lend depositor funds to mortgage borrowers.
- He links early-2000s subprime lending to abundant funds, including capital flowing back to US financial markets from China's trade surpluses.
- When adjustable mortgage rates rose, defaults and foreclosures increased housing supply, pushing resale prices down and leaving lenders unable to recover principal.
- A fixed 10% rate can be represented as one factor, (1 + r), repeated across the full term.
- With changing annual rates, future value instead multiplies separate factors such as (1 + R1), (1 + R2), and continuing through each year.
- Replacing different annual rates with a single average rate requires finding a rate that reproduces the same ending value after compounding.
- Jeff Hong maps 2005 to time zero and 2006 to time one, treating the 2016 house value as the endpoint of an 11-year period.
- The house-price series rises from about $150,000 and shows an upward trend, so its annual changes compound over time.
- Because the arithmetic average does not reproduce the compounded endpoint, the lesson shifts to geometric averaging.
- The geometric-average growth rate is derived from the ratio of future value to present value raised to the power 1/n, then reduced by one.
- For the housing data, Excel can calculate n as 2016 minus 2005 rather than entering 11 manually.
- A second method uses COUNT on the annual data range to determine the number of periods.
- Applying the geometric average to the initial house value reproduces the actual 2016 value after 11 years of compounding.
- Applying the simple arithmetic average overshoots the observed endpoint, demonstrating why it is unsuitable for compounded time-series returns.
- The comparison confirms that the geometric average is the consistent annual rate for a multi-year price series.
- In scenario one, annual growth in house value and annual return are equivalent because there is no additional cash flow.
- In scenario two, annual return includes both the capital gain and rental income, divided by the previous year's house value.
- Jeff Hong uses the first three blank rental-income entries to illustrate that the two measures coincide when cash flow is zero.
- The simple future-value formula for a house price alone cannot capture scenario two's additional rental cash flows.
- Jeff Hong derives a geometric-average expression by setting the compounded average growth factor equal to the product of the year's individual growth factors.
- The notation Π denotes multiplying each (1 + gi) term, while raising the product to 1/n converts it into an average annual factor.
- Column H calculates each annual gross factor as 1 + g, using the annual growth or return value from the worksheet.
- Excel's PRODUCT function multiplies the annual factors, and COUNT supplies the number of periods for the 1/n exponent.
- Subtracting one from the resulting average gross factor converts it into a net geometric return.
- The worksheet's product-based calculation raises the gross-return product to 1 divided by the counted number of annual observations, then subtracts one.
- Jeff Hong reports a geometric average of 16.34% for the cash-flow return series.
- He demonstrates Excel's GEOMEAN function as a check, while explaining that it must be applied to the 1 + r factors and followed by subtracting one.
- Entering raw annual returns into GEOMEAN does not produce the correct net compounded return; the inputs must first be converted to gross factors, 1 + r.
- GEOMEAN returns an average gross factor, so subtracting one is necessary to recover net return.
- Understanding the mathematical construction helps prevent formula errors even when Excel supplies a built-in function.
- Students use fresh green check marks to confirm they obtained the same result, and Jeff Hong captures a final class screenshot.
- He asks students to save the completed Excel file and offers office hours or a Thursday session for further questions.
- The class ends with a reminder that the geometric-average calculation should match the reported 16.34% result.
Transcript excerpt
0:54 All right. Good afternoon everyone. Good afternoon. >> Good afternoon. >> Hi. Good afternoon Valerie. >> Good afternoon. Uh that's Dennis. Uh I see also uh Oshola Wish Sahara. >> All righty. Uh I see only two people with a camera on but uh please if you um [clears throat] if your camera is not on please turn it on now and let me also there are two people. All righty. So, I think I have how many
1:43 people? I >> This just said turn the cameras on. >> My teacher, I'm not turning a thing on. >> Yeah, please turn it on. Please turn it on. >> All right. So, uh let me um >> Okay. Hide floating reading control. So everyone please open this file that you were working on last time last Thursday. Uh we were working on this Excel file, right? Did I just admit it? Okay. Admit that person, right? Did I admit that person a while ago?
2:34 Uh do you have it? Even if I didn't tell you to uh save it, you should have saved I mean any file that you are working on, right? Uh you should you should save it for later, right? U okay keeps me okay constantly. Uh so if you have this file uh please uh give me that green check mark right yeah in the react buttons right at the bottom you will see react button and if you click on it uh you will see um green check mark if you have this file please
3:22 um give me that green check mark Okay. All right. Noel, thank you. Sahara, thank you. And Oshola and Dennis and Nicholas, Valerie, thank you. Uh, what about the rest of the class? Ana, thank you. And Wii and Michael Michael Ktos. And
This is the start of the transcript. Save this video free for the whole transcript, searchable and time-coded.
In this course
Related notes
Summary, takeaways, and chapters were generated by AI from the video's transcript and may contain errors. The video belongs to its creator, Jeff Hunk.