EDF9850_Lecture2_Part1
Overview
Lesa Hoffman introduces two-level empty means models by splitting outcome variability into within-cluster residual variance and between-cluster random-intercept variance, then explains what ICC1 and ICC2 measure. Using R packages lme4 and lmerTest and a dataset of 3,566 students in 191 schools, she shows how clustering affects effective sample size, why ICC can increase after adding person-level predictors, and why predicted random intercepts should not be treated as observed cluster effects.
Key takeaways
- In a two-level empty means model, total outcome variability is partitioned into between-cluster random-intercept variance and within-cluster residual variance; this partition describes where variation occurs, not why it occurs.
- ICC1 is both the between-cluster share of total variance and the expected correlation between two people from the same cluster, making it a direct measure of outcome dependence.
- In Hoffman's school-language example, ICC1 is about 0.223, and clustering reduces the effective sample size from 3,566 students to roughly 711 when average school size is 19.
- A small empty-model ICC does not guarantee low dependence in a model with predictors: reducing person-level residual variance can increase the estimated random-intercept variance and conditional ICC.
- ICC2 describes the reliability of cluster means; it improves with more people per cluster but is limited when true differences between cluster means are small.
- Predicted random intercepts are shrunken estimates, not observed cluster effects; cluster-level variability should be modeled directly rather than analyzed as though those predictions were raw data.
Chapters
- A general linear model has a means component, with fixed-effect coefficients such as β0 and predictor slopes, and a variance component represented by residuals.
- In a single-level empty means model, the grand mean predicts every person's outcome; residual variance is the outcome variance when the only fitted term is an intercept.
- Two-level notation uses person P and cluster C subscripts, such as Ypc, to make the sampling dimensions explicit.
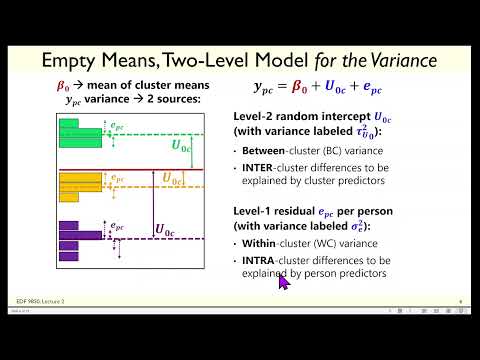
- The random intercept U0c represents how far cluster C's mean differs from the grand mean of cluster means, γ00.
- Level-one residual Epc represents how far person P differs from their own cluster mean; its variance is within-cluster variance, while Var(U0c) is between-cluster variance.
- The hierarchical model has three estimated quantities: the fixed intercept γ00, the level-two random-intercept variance, and the level-one residual variance.
- The same model can be written as one composite equation, but hierarchical notation makes the level-specific terms easier to interpret.
- ICC1 is Var(U0c) divided by Var(U0c) plus Var(Epc), so it measures the proportion of total variance that lies between clusters.
- ICC1 also represents the expected correlation between two people from the same cluster, because larger between-cluster differences relative to within-cluster differences make cluster members more alike.
- An ICC1 near zero indicates little between-cluster mean variation; an ICC1 near one implies negligible within-cluster variation.
- Hoffman distinguishes variance partitioning from variance explanation: an empty model separates the two sources but does not explain why clusters differ.
- The example contains 3,566 students in 191 schools, with language scores averaging about 41 and total variance near 77.69.
- A single-level R model with only an intercept estimates the outcome mean and variance; adding a school random intercept uses lme4's lmer function, with lmerTest for fixed-effect tests.
- The fitted school variance is about 17.8 and the student-level residual variance is about 62.2, giving ICC1 of approximately 0.223.
- About 22% of language-score variance is between schools, and the expected correlation between students at the same school is about 0.22; the fixed intercept now estimates the mean of school means.
- The design effect depends on ICC1 and average cluster size, and effective sample size is total observations divided by the design effect.
- With 500 patients in 100 doctor groups of five and ICC1 = 0.30, the design effect is 2.2 and the effective sample size is about 227.
- With 1,000 students in 50 schools of 20 and ICC1 = 0.05, the effective sample size is still only about 513, showing that a small ICC is not automatically negligible.
- For the school-language example, ICC1 = 0.223 and average cluster size 19 produce a design effect near 5 and an effective sample size of about 711 rather than 3,566.
- Ignoring clustering can distort fixed-effect standard errors and slopes; a clustered standard-error correction alone does not address confounding between person-level and cluster-level effects.
- Random-intercept variance estimation adjusts for cluster-mean differences expected from sampling noise, approximated by level-one residual variance divided by cluster size.
- When a person-level predictor reduces residual variance, the adjustment for sampling noise shrinks, which can increase estimated between-cluster variance and conditional ICC.
- Consequently, an empty-model ICC of zero or near zero does not guarantee that clustering will remain negligible after predictors are added.
- Hoffman illustrates school differences in the outcome's original scale by taking the mean of cluster means plus or minus roughly two random-intercept standard deviations, yielding an example range of about 32.8 to 49.4.
- ICC2 measures the reliability of cluster means and depends on both between-cluster variance and the number of people per cluster; the school example has ICC2 of about 0.85.
- Observed cluster-mean variance is largest, model-estimated random-intercept variance is smaller after adjustment for sampling noise, and variance in predicted random intercepts is smallest because of shrinkage.
- Predicted random intercepts are best linear unbiased predictors that shrink less reliable or extreme cluster estimates toward the center, so Hoffman advises modeling cluster differences directly rather than treating these predictions as observed values.
- The two-level model partitions variability into between-cluster and within-cluster components and represents same-cluster dependence with ICC1; what counts as between or within depends on the sampling design.
Transcript excerpt
0:01 Hello folks and welcome back to my home office. Today I am here to talk about le lecture two the first real lecture in our course on multi-level models taking us from empty models to level two predictors. So in the previous class you would have heard my sales pitch my encouragement to stick with this. I hope it worked and away we go. So, as we talked about very briefly last time, the way that I describe models is as having two distinct sides. And given that most of you, I believe have had a regression course or two, a general linear model or what we would call regression nova and kova that family is a good place to start. So in this example model, I have one outcome y for
0:50 person p as a function of a fixed intercept beta 0, a slope for a predictor x1, a second slope for the predictor x2, this means and so on, and then a residual. So what are the two sides of this model? Well, the red parts correspond to what I call the model for the means, which is how the model generates predicted outcomes as a weighted linear function of the predictors where the betas are the weights. They are estimated constants. In this class, they will be called fixed effects. Fixed effects mean they are estimated as one number for the entire sample. That is the only choice that you have in a general linear model. And so they might just be called intercepts or slopes in the coursework that you had. I however refer to them on purpose as fixed effects because I know this is
1:38 coming. The other side of the model is E right here and this is what we call a residual and what I refer to more
This is the start of the transcript. Save this video free for the whole transcript, searchable and time-coded.
In this course
Related notes
Summary, takeaways, and chapters were generated by AI from the video's transcript and may contain errors. The video belongs to its creator, Lesa Hoffman.