EDF9850_Lecture1_Part1
Overview
Lesa Hoffman introduces the first offering of Multilevel Models for Educational Data, explaining the course’s mastery-oriented structure, public course website, R-based examples, and flexible support for students with different programming backgrounds. Assessment includes five participation-based class activities, three individualized R homework assignments, and a revisable applied project; the opening lesson defines clustered and cross-classified data and shows how multilevel models apply across education, health, longitudinal research, and psychometrics.
Key takeaways
- Hoffman’s mastery-learning approach awards credit for thoughtful attempts, lets students retry computational homework, and allows a revised final presentation rather than requiring perfection on the first try.
- The three R homework assignments use student IDs as random seeds to create individualized datasets, pairing immediate feedback on numerical answers with practice interpreting results in manuscript-style paragraphs.
- R is the course default because it is free and extensible, but Hoffman also offers support for SAS, Stata, SPSS, and Mplus; she does not support Python or JMP.
- Multilevel modeling covers more than students nested in schools: examples include repeated measures, patients nested in hospitals, survey respondents across countries and years, and psychometric item-response structures.
- A cross-classified model can represent students linked to both schools and neighborhoods, but separating additional variance or interaction effects requires a sampling design with enough overlap and repeated observations.
- Students should start technical homework early and send Hoffman screenshots of code and errors; her recommended troubleshooting threshold is 15 minutes before stepping away and asking for help.
Chapters
- Lesa Hoffman explains that class recordings will be posted to YouTube, with searchable transcripts for locating specific concepts.
- Canvas is reserved mainly for assignment collection, announcements, and readings; course materials will remain on an external website for access after the semester.
- Zoom office hours are scheduled for Mondays 10:00 to 11:00 and Tuesdays 12:00 to 1:00, with individual meetings possible at other times.
- A deliberately simple, single-page website organizes weekly topics, tasks, and linked materials by date.
- Lecture PDFs and recorded videos are linked alongside Canvas activities, and the site also links directly to the YouTube playlist.
- The external site provides a fallback if Canvas is unavailable, with email or other low-tech submission options as a backup.
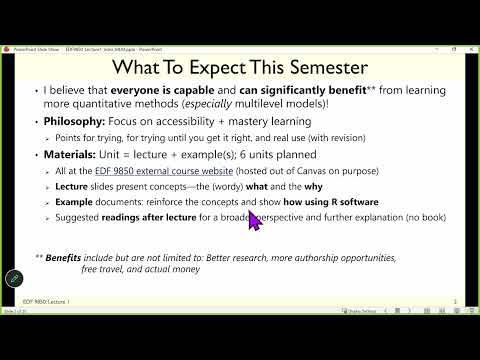
- Hoffman’s course philosophy assumes students can learn quantitative methods and uses accessibility and mastery learning to support different starting points.
- Students earn participation credit for making reasonable attempts, can retry homework until computational answers are correct, and can revise the final project.
- Dense slides are designed to reduce note-taking; annotated PDFs combine code, output, explanations, and questions so students are not blocked when live code fails.
- Multilevel models include familiar approaches such as repeated-measures ANOVA, growth-curve models, daily-diary analyses, value-added models, and psychometric models.
- The course expects prior knowledge of regression and general linear models, including ANOVA and ANCOVA; earlier regression and generalized-modeling materials are available for review.
- Planned units cover level-two predictors, level-one predictors, random slopes and cross-level interactions, with possible extensions to longitudinal and cross-classified designs.
- R is free, installable on personal devices, usable through Citrix, and extensible through packages for newer models, plots, tables, and post-processing.
- Hoffman aims to keep coding minimal and readable, prioritizing transparent base R over shorter tidyverse or pipe-based code.
- AI tools such as Claude Code and ChatGPT can help explain code, but their answers need verification; Hoffman can also support SAS, Stata, SPSS, and Mplus, but not Python or JMP.
- Five planned in-class activities use Shiny apps or guided practice; students can work alone or in groups and earn two points each for reasonable responses.
- Canvas formative assessments use short answers to check vocabulary, concepts, and notation, later extending to story problems and methodological review.
- Hoffman asks students not to use AI for these comprehension checks because their purpose is to reveal what students understand and where review is needed.
- Three assignments follow units two, three, and four, using Hoffman’s custom system and templates to reduce the coding burden.
- Each student’s ID serves as a random seed for a unique simulated dataset, so numerical answers differ even when assignment instructions match.
- Computational answers receive immediate green or red feedback, while interpretation paragraphs practice describing estimates, significance, and variance explained in manuscript-style results.
- Students must submit syntax and output in a text file or Word document; a short syllabus-based Homework 0 offers up to two extra-credit points.
- Students may complete the project individually or in pairs, applying multilevel models to data relevant to their research or work.
- Project milestones include a plan outlining data, variables, and research questions, followed by a results check-in before presentations.
- Conference-style presentations are scheduled for November 12 and 19; students receive a rubric and may re-record after feedback, with final revisions due at the end of finals week.
- Students review one classmate’s presentation after Thanksgiving, and Hoffman can help adapt projects involving non-continuous outcomes or models beyond the course.
- Work is accepted up to two weeks late with modest penalties; advance written extension requests are welcome, and due dates will not move earlier.
- For coding help, Hoffman recommends emailing screenshots and stepping away after 15 minutes stuck rather than waiting until the 11:59 p.m. deadline.
- Attendance is not taken, and students may switch between classroom and Zoom; students should stay home when sick, and schedule changes will be announced by 8:00 a.m. on class days.
- Hoffman may move class online or cancel for illness, dangerous weather, or caregiving needs, and the week after the two-day fall break is currently class-free due to a conference.
- Clustered, nested, group, and hierarchical data refer to outcomes sampled across multiple dimensions, such as students within classes or schools.
- Each sampling dimension is a model level; a two-level design might represent students at level one and schools at level two, while students, classes, and schools create three levels.
- Examples include patients within doctors and hospitals, citizens within countries, and repeated observations within people.
- Multilevel models are also called mixed-effects models, general linear mixed-effects models, random-coefficients models, or hierarchical linear models; the course focuses on univariate outcomes.
- Cross-classified data arise when units belong to overlapping groupings, such as students associated with both schools and neighborhoods.
- Repeated survey respondents may be nested within survey year, and intensive longitudinal data can nest occasions within days and days within people.
- In reliability studies, targets rated by multiple raters can separate target, rater, and target-by-rater variation when the sampling design provides repeated observations.
- Cross-classified variance or interactions can only be distinguished when the design supports it; Hoffman identifies the main challenge as keeping many model components in working memory.
Transcript excerpt
0:00 recording, because I capture these classes. That way you never have to miss anything. So, welcome back to school. I know some of you are teachers. You're like, "Yeah, I've been doing school for a couple weeks." But, this kind of school is a novel thing. So, I am going to be your host for the semester. Officially, I am Professor Lisa Hoffman, but you can just call me Lisa. It's fine. Um my name is spelled differently. It's l e s a, but it's pronounced the usual way. The story is when I was born, my mom said that I looked like a Lisa, but not the regular kind. So, she adapted accordingly, and I don't know what the regular kind looks like, but I just know that I've met like five people in my life that have my name. And every time it's like, "Ooh, you're one of us." It's very exciting. So, anyway, Lisa is fine.
0:48 Um I sent you an email, and I posted announcements on Canvas for where the course website is. So, I will point to that in just a moment. Um I only use Canvas for select things. I use it for collecting work. Your readings will be there in under files in a big zip folder. And that's about it. >> [laughter] >> Announcements, that's it. So, I will keep all of the course materials on an external website, and I do that for several reasons. Um one is for future you, because that way when you come back to this material down the road, should you actually need to do this in life, which I hope is the case, then you have the resources readily available. Whereas, in Canvas, you lose access after a certain period of time. Uh the second is because folks around
This is the start of the transcript. Save this video free for the whole transcript, searchable and time-coded.
In this course
Related notes
Summary, takeaways, and chapters were generated by AI from the video's transcript and may contain errors. The video belongs to its creator, Lesa Hoffman.