*CE 312 Lecture 19: Shear/Moment Diagrams IV, Triangular Loads & Plotting w/ Excel (2026.09.30)
 Watch on YouTube →
Overview
Gregory Michaelson derives shear and moment equations for a simply supported 30 ft beam carrying a triangular load that increases from 0 to 2 kip/ft, then uses Excel to plot the resulting diagrams. The method combines equivalent-load statics, section cuts, and equilibrium, giving V(x) = 10 - x²/30 and M(x) = 10x - x³/90; the maximum moment is about 115.5 kip-ft at x = √300 ≈ 17.32 ft.
Key takeaways
- For the 30 ft beam with a load increasing from 0 to 2 kip/ft, the equivalent full load is 30 kips acting 20 ft from A, producing reactions Ay = 10 kips and By = 20 kips.
- At a section x feet from A, the partial triangular load has height x/15 kip/ft, resultant x²/30 kips, and a line of action x/3 from the cut.
- Section equilibrium gives V(x) = 10 - x²/30 kips and M(x) = 10x - x³/90 kip-ft; differentiating the moment equation verifies the shear equation.
- The maximum bending moment occurs where shear equals zero, at x = √300 ≈ 17.32 ft, and is approximately 115.5 kip-ft.
- An Excel scatter plot using 1 ft increments can display the shear and moment curves, while the endpoint values and the zero-shear location help validate the calculations.
Chapters
- Homework 5.4 requires an Excel sheet that plots a beam’s shear and moment diagrams, with supporting calculations submitted in the workbook or a separate document.
- Integrating a load distribution gives shear, and integrating shear gives moment; differentiation reverses those relationships.
- A linearly varying triangular load produces a quadratic shear function and a cubic moment function.
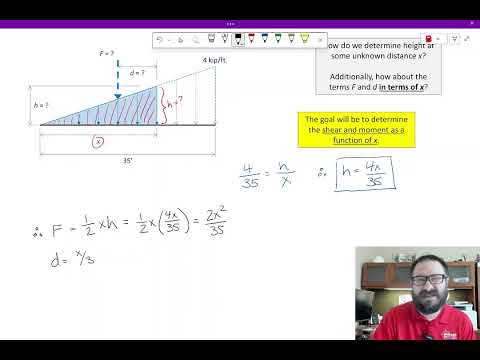
- For a triangle rising from 0 to 4 kip/ft over 35 ft, similar triangles give the height at distance x as h = 4x/35.
- The partial triangular load’s resultant equals its area, F = ½xh = 2x²/35.
- The resultant acts x/3 from the triangle’s high end; at x = 35 ft, the full resultant is 70 kips.
- The example beam is simply supported over 30 ft, with a downward triangular load increasing from 0 to 2 kip/ft.
- Replacing the full distributed load with its equivalent point load gives 30 kips acting 20 ft from support A.
- Moment equilibrium about A gives By = 20 kips, and vertical force equilibrium gives Ay = 10 kips.
- The shear diagram jumps from 0 to 10 kips at A, then curves downward under the linearly increasing load and reaches -20 kips just before B.
- Because load is linear, shear is parabolic; its slope begins near zero at A where the distributed load starts at zero.
- Moment starts and ends at zero, reaches a maximum where shear crosses zero, and has a cubic shape.
- Michaelson cuts the beam at an arbitrary distance x from A and analyzes the simpler left-hand free-body diagram.
- Similar triangles give the partial load’s height as h = 2x/30 = x/15, so its equivalent force is F = ½x(x/15) = x²/30.
- The partial triangular load’s resultant acts x/3 from the cut, a distance needed for moment equilibrium.
- Careful free-body diagrams help prevent errors in force labels and moment arms, especially when later deriving deflection equations.
- Vertical force equilibrium on the left segment gives V(x) = 10 - x²/30, with forces measured in kips and x in feet.
- Taking moments at the cut gives M(x) = 10x - x³/90, measured in kip-ft.
- Differentiating M(x) reproduces V(x), providing a consistency check without integrating or using calculus to derive the equations.
- Integration can also recover moment, but an indefinite integral introduces a constant that must be set using boundary conditions.
- The spreadsheet lists x from 0 to 30 ft in 1 ft increments and calculates shear and moment using the derived equations.
- An Excel scatter plot with straight lines graphs x against shear; formatting adds axis titles, units, readable scales, and a chart title.
- Copying the formatted shear chart and changing its data series creates the moment plot with less repeated setup.
- The plotted shear runs from 10 to -20 kips, while moment returns to zero at both supports, matching the expected diagram shapes.
- Setting 10 - x²/30 = 0 gives x = √300 ≈ 17.32 ft, where the shear changes sign.
- Substituting x ≈ 17.32 ft into M(x) = 10x - x³/90 gives a maximum moment of about 115.5 kip-ft.
- The maximum moment occurs where shear is zero, not at the triangular load’s centroid; the Excel plot provides a visual check of both results.
- Homework 5.4 applies the same workflow: derive the expressions, calculate values, and plot shear and moment in Excel.
Transcript excerpt
0:01 Okay, so this is lecture 19 uh in structural analysis. So again, everybody's counted present for this week. Uh by the time that this lecture goes live, homework 5.2 uh the solution is going to be posted. Homework 5.3 will be due today and then 5.4 will be assigned today. This homework's going to be a little bit different because your submission is actually going to be an Excel sheet. Um, so what you're going to do is prepare an Excel sheet that will uh plot the shear and moment diagram for a given beam. Um, we're going to talk about uh what that means today and and sort of the motivation behind that. Um, one thing I'll say in terms of the logistics, so the ex uh the submission is ultimately going to be an Excel file, but there'll be some computations on on um how to generate some of the equations
0:48 for that. if you want to include the equations direct or the the computations directly in the Excel file or if you want to upload them as a separate document either one should be fine. Um but you will kind of need to uh upload both because if there's something wrong in the Excel file it might be because the computations uh are error uh but with that um let's go ahead and get started and talk about how to plot shear and moment diagrams for triangular loads. So let me minimize this and go to the notes. Okay. So um again uh and and this will sort of be a running theme for a number of the lectures that we are um uh uh discussing in this module but we are still using the same relationship between loads and shears and shears and moments. the idea that if you
This is the start of the transcript. Save this video free for the whole transcript, searchable and time-coded.
Related notes
Summary, takeaways, and chapters were generated by AI from the video's transcript and may contain errors. The video belongs to its creator, Gregory Michaelson.