BIOL 105 Lecture 4 8/31/26
Overview
Jonathan Montgomery reviews how to choose among t-tests, ANOVAs, and regressions by identifying whether explanatory and response variables are categorical or continuous, then explains how to interpret p-values and read primary research articles. He uses his biochar-and-compost turfgrass study to illustrate article sections and discusses meta-analysis and Google Scholar tools for finding and citing research.
Key takeaways
- Choose among the core statistical tests by variable types: categorical predictor plus continuous response means a t-test for two groups or an ANOVA for more than two, while two continuous variables call for regression.
- A p-value describes the probability of the observed results under the null hypothesis; a low value is evidence against that null, but does not by itself establish causation.
- Primary research articles typically organize their work into an abstract, introduction, materials and methods, results, and discussion; methods should provide enough detail for replication.
- Montgomery's turfgrass example shows how a discussion interprets results: high-salinity biosolids compost reduced establishment, and adding biochar mitigated that negative effect.
- Meta-analysis can produce original findings from previously collected studies, but valid synthesis depends on checking whether data collection methods and measurements are comparable.
- Google Scholar can streamline research discovery and citations: use the Cite button for formatted references and Cited by to find newer work building on a relevant paper.
Chapters
- The 10-point reading quiz covers material from Chapters 2, 3, and 4 as one combined quiz.
- The online chemistry review worksheet covers dilution and solution calculations, with guidelines in the week's lab handout.
- Find lecture slides in the Week 2 overview and lab materials, including a prelab video and the handout on spectrometry, dilutions, and standard curves.
- A claim that researchers are testing whether Zika virus causes birth defects is a hypothesis, not a scientific theory.
- A p-value is the probability of obtaining the observed results, or more extreme results, if the null hypothesis is true.
- The null hypothesis typically states that the independent variable has no effect on the dependent variable.
- The independent variable is the explanatory variable; the dependent variable is the response to changes in it.
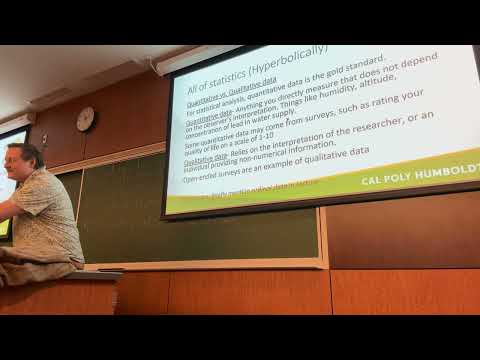
- Quantitative data can be measured consistently, such as plant height, while qualitative data describes qualities such as whether a dog is energetic or lazy.
- Categorical data sorts observations into groups, while continuous data can take values across a range.
- Thermos height measured in centimeters is continuous because measurements can fall anywhere within a range, such as 0 to 100 centimeters.
- Sorting those same thermoses into short, medium, and tall groups turns the recorded outcome into categorical data.
- For mugs measured with lids on and off, lid status is categorical while height remains continuous; percentage change in height is another continuous measure.
- A p-value below 0.05 is commonly treated as statistically significant and used to reject the null hypothesis.
- Tests such as t-tests and ANOVAs generate statistics such as t or F values, which are evaluated against a critical value to determine significance.
- For interpreting a study, identify the independent and dependent variables and use the p-value as evidence about results under the null hypothesis, not as proof of causation.
- A categorical explanatory variable paired with a continuous response variable calls for a t-test when there are two categories, or an ANOVA when there are more than two.
- Comparing beetle color groups, such as purple, green, and blue, with continuous beetle speed is an ANOVA example.
- A continuous explanatory variable and continuous response, such as elevation and tree height, are analyzed with a regression, which may be linear or nonlinear.
- Montgomery identifies t-tests, ANOVAs, and linear regressions as the three main tests to recognize, with chi-square tests planned for a later course week.
- Primary research articles report original research and are evaluated by peer reviewers with relevant expertise.
- Authors may collaborate on research and writing, while graduate students often perform hands-on work; authorship does not always reflect every contributor.
- A meta-analysis can count as original research by analyzing previously collected data with a new model or approach, even if its authors collect no new measurements.
- Peer review relies on reviewers who may be volunteers, and the process can take months or up to a year.
- Montgomery's study in the Agronomy Journal examines how biochar and compost affect turfgrass establishment rates.
- The abstract summarizes the study's rationale, results, and interpretation; the introduction explains why the research matters.
- Materials and methods should give enough detail to repeat the study, including seed type, seeding rate, mowing schedule, location, and statistical analyses.
- The results section reports findings without interpretation, while the discussion interprets them and proposes future research.
- Biochar is produced by heating organic material in a low-oxygen pyrolyzer, converting much of its carbon into a stable solid that may support carbon storage and soil water and nutrient retention.
- In Montgomery's turfgrass example, high-salinity biosolids compost slowed establishment, while combining it with biochar reduced the compost's negative effect.
- Meta-analysis combines results from multiple independent experiments while accounting for variation, but researchers must check whether methods and measurements are comparable.
- Google Scholar's Cite button provides citation formats or downloadable reference-manager files; Cited by helps locate newer studies that reference a useful article.
- A practical literature-search workflow is to screen an article's abstract, use its citations and Cited by results to find related research, and build a source list.
Transcript excerpt
0:01 All right, that's the recording started. It's what? August uh 31st. All right, biology 105. Sick. Welcome back, everybody. Uh thank you all for making it again to class. Let's go ahead and start off by looking at where we are in the semester, what you have to do this week. I'll do this most weeks. Um we're going to move on to some new topics. You've got a reading quiz. This here says quiz chapter 2, three, and four. That does not mean quiz two, quiz three, quiz four. All right, it's one quiz covering material from those three chapters. Awesome. Worth 10 points. You've got a chemistry review worksheet. That's an online lab assignment. All right. I'm going to be asking you to do some equations about doing dilutions,
0:49 making solutions, the guidelines for how to do those calculations. They're all going to be in your handout this week. So, don't forget to print your lab handout for this week. Keep building up that lab notebook. All right? And before you know it, we're going to be moving into some exciting new material. I think that in week three, it starts to get really fun. All right. Cool. So, that's that. Once again, remember here's the week 2 module. If you want the lecture PowerPoint, it's here in the week 2 overview. You can find it right there. If you want the lab materials, they're going to be here in laboratory materials week two. Uh there's a prelab video with some demonstration stuff. Here's your actual
1:37 print the file below and bring to lab lab handout. Oh yeah, specttometry dilution standard curves. Important foundational concepts that we're going to be using again and again and again and again. You're going to do so many standard curves this semester. You're
This is the start of the transcript. Save this video free for the whole transcript, searchable and time-coded.
In this course
Related notes
Summary, takeaways, and chapters were generated by AI from the video's transcript and may contain errors. The video belongs to its creator, Jonathan Montgomery.