Root Mean Square Speed, Diffusion, and van der Waals Equations
Overview
John Flood uses PhET gas simulations to connect kinetic molecular theory with Maxwell-Boltzmann speed distributions, root mean square speed, diffusion, and effusion. He applies the RMS relation, u_rms = √(3RT/M), and Graham’s law to numerical gas problems, then introduces nonideal behavior through the van der Waals equation and previews energy as a state function.
Key takeaways
- At a fixed Kelvin temperature, gases have the same average kinetic energy, but a lower molar mass produces a higher RMS speed according to u_rms = √(3RT/M).
- RMS-speed calculations require temperature in Kelvin and molar mass in kg/mol; using nitrogen’s 28 g/mol instead of 0.028 kg/mol gives a result off by a factor of about 1,000.
- Mean free path is the average distance between collisions; adding particles or reducing volume increases pressure and shortens that path.
- Diffusion spreads particles from high to low concentration, and its rate decreases as the concentration gradient disappears.
- Graham’s law makes gas rate inversely proportional to the square root of molar mass; hydrogen therefore effuses about four times faster than oxygen.
- The van der Waals equation accounts for real-gas attractions with a and finite particle volume with b, correcting the ideal-gas pressure and volume terms.
Chapters
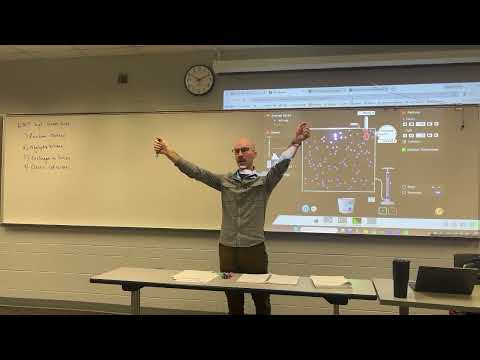
- John Flood introduces PhET, developed by the University of Colorado Boulder, and recommends its gas simulations for Unit 7.
- The ideal-gas simulation lets users change moles, volume, and temperature while observing pressure changes.
- Heating and cooling affect particles near the simulator’s bucket first, then spread through the gas.
- Gas particles move randomly, have negligible volume, and exert no intermolecular forces in the ideal-gas model.
- Collisions are elastic, so particles lose no kinetic energy in collisions.
- Average kinetic energy is proportional to absolute temperature in Kelvin.
- The PhET energy-distribution display illustrates that gas particles have different speeds at any moment.
- A Maxwell-Boltzmann curve plots particle count against speed, with most particles near the peak and few at the slow or fast extremes.
- Collisions continually shift particles between speeds while the overall distribution remains roughly stable.
- The peak of a Maxwell-Boltzmann curve is the most probable speed, labeled v_p.
- Root mean square speed is found by squaring particle speeds, averaging those squares, and taking the square root.
- The RMS speed lies to the right of the most probable speed on the distribution.
- The average kinetic energy can be represented using one-half mass times RMS speed squared.
- Combining the kinetic-energy and temperature relationship gives u_rms = √(3RT/M).
- The equation requires the gas constant in energy units and molar mass M in kilograms per mole to produce meters per second.
- At the same Kelvin temperature, helium’s low molar mass gives it a higher RMS speed than neon or argon.
- As molar mass increases, the distribution shifts toward lower speeds.
- The distributions also differ in width: lighter particles span a broader range of speeds.
- At 300 K, light and heavy particles have the same average kinetic energy but express it at different speeds.
- Cooling shifts both light- and heavy-gas distributions toward lower speeds; heating broadens them and raises their RMS speeds.
- John Flood contrasts fast-moving gas particles with solids, whose heavier, strongly interacting particles mainly vibrate.
- For nitrogen at 22 °C, the temperature must be converted to 295.15 K before using u_rms = √(3RT/M).
- Nitrogen’s molar mass is 28 g/mol, or 0.028 kg/mol, for consistency with the SI form of R.
- The worked result is approximately 513 m/s, after checking that the units reduce to meters per second.
- At equal temperature, N₂ moves faster on average than O₂ because N₂ has the lower molar mass.
- CO₂ is heavier than O₂, while H₂O has the lowest molar mass among the four gases discussed.
- Water vapor’s tendency to condense is linked to intermolecular attractions, unlike the ideal-gas assumption of no attractions.
- Mean free path is the average distance a gas particle travels before colliding with another particle or a container wall.
- Adding particles or reducing container volume increases collision frequency and shortens the mean free path.
- Both changes raise pressure by increasing particle collisions with surfaces.
- Diffusion is the spontaneous dispersion of particles from a high-concentration region into a low-concentration region.
- John Flood uses smells and food coloring in water as familiar examples of diffusion.
- In the simulator, removing a divider lets red and blue particles spread through the available space.
- The simulation compares equal numbers of particles at different temperatures, showing faster motion for the hotter gas.
- After the divider is removed, particle collisions help the gases approach thermal equilibrium and become more evenly distributed.
- With nitrogen and oxygen at equal temperature, the lighter nitrogen diffuses somewhat faster, though the displayed difference is modest.
- The rate of diffusion is described as the amount of gas crossing an area per unit time.
- A larger concentration gradient produces a faster initial rate, which declines as the gradient disappears.
- The lesson links available travel distance and surface area to mean free path and explains that increased pressure shortens mean free path.
- In the simulation, a region with more particles has both higher concentration and higher pressure.
- Removing a divider between unequal-pressure regions allows particles to spread toward the lower-pressure side.
- John Flood relates higher pressure to shorter mean free paths and a lower diffusion rate once particles are moving through the gas.
- Effusion is the passage of gas particles through a small hole, unlike diffusion through a larger opening or shared space.
- Effusion rate is defined as the amount of gas passing through an area per unit time.
- The rate is inversely proportional to the square root of molar mass, so lighter gases effuse faster.
- Graham’s law compares two effusion rates using the square root of the gases’ molar masses.
- Helium’s low molar mass explains why helium balloons lose gas faster than balloons filled mainly with nitrogen and oxygen.
- The same rate-ratio relationship can compare two diffusion rates, provided both rates refer to diffusion or both to effusion.
- For oxygen at 21 °C, John Flood converts the temperature to 294.15 K and uses a molar mass of 32 g/mol, or 0.032 kg/mol.
- A stated pressure of 15.7 atm is irrelevant to the RMS-speed calculation because the equation uses temperature and molar mass.
- For hydrogen relative to oxygen, the rate ratio is about 4, meaning hydrogen effuses roughly four times faster.
- An unknown gas diffuses at 18.0 mL/s while carbon monoxide diffuses at 14.1 mL/s; carbon monoxide has a molar mass of 28 g/mol.
- Because the unknown diffuses faster, it must have a lower molar mass than carbon monoxide.
- Applying the rate-ratio equation and solving for the unknown’s molar mass gives about 17.2 g/mol, consistent with ammonia, NH₃.
- Real gases have particle volume and intermolecular attractions, and their collisions may not behave as perfectly elastic ideal collisions.
- At high pressure, particles occupy a meaningful fraction of the container’s volume.
- At low temperature, attractions can slow particles and contribute to condensation, as with water vapor.
- The van der Waals equation is (P + a n²/V²)(V − nb) = nRT, correcting the ideal gas law for attractions and finite particle size.
- The constant a represents the strength of intermolecular attractions, while b accounts for particle volume; both are specific to the gas.
- The equation is not on the provided equation sheet, so John Flood says any exam problem using it would need to supply the equation and constants.
- The assigned van der Waals problem uses 6.49 mol of helium in a 6.75 L flask at 310° and supplies helium-specific a and b values.
- Solving for pressure requires rearranging the van der Waals equation and using RMS speed, with helium’s molar mass of about 4 g/mol.
- John Flood previews energy as a state function: hiking or parachuting to the summit of Mount Kilimanjaro gives the same net change in potential energy.
- The next unit begins with pressure-volume work, then moves to calorimetry and enthalpy.
Transcript excerpt
0:00 All right, good morning everybody. Um, I wanted to bring you guys back to the FET simulator. Um, which, uh, actually stands for physics education training. Um, this was developed by CU Boulder, but, uh, by their physics department. I don't know if you guys know this, but CU Boulder is the leading school for physics in the nation. Their physics program is so strong. They have oh, I can't say anymore. I want to say like five Nobel Prize laurates that used to teach at CU Boulder uh in in physics. Yeah. Well, some of them are dead now.
0:47 So, I hope they don't teach there anymore. um their physics program is so good that they they interact with the chemistry program and have physical chemistry bumped really high up in the list uh in the world of physical chemistry as well. So their physics program is so good it elevates their chemistry program. Anyways, they started here making this simulator for physics, but there's a lot of good stuff on here for chemistry as well. To find it, I don't think that it's linked on canvas, but it might be linked in real chem. You can just search FET ph and it'll come up. Um, I wanted to show you guys that there are a number of different
1:35 uh gas simulations that you can use. So, as you're going through unit seven, I encourage you to come in and play around with some of these simulators. Here's an ideal gas that we can explore. So, remember the four properties of gases. Yep. Pressure, volume, temperature, and moles. So what I'm uh what I'm doing by pumping is changing moles and by changing the number of moles of course then I change the pressure and the temperature. Um I can I can use this
This is the start of the transcript. Save this video free for the whole transcript, searchable and time-coded.
In this course
Related notes
Summary, takeaways, and chapters were generated by AI from the video's transcript and may contain errors. The video belongs to its creator, John Flood Chemistry.