NDSU ECE 211 Online Lab 5
 Watch on YouTube →
Overview
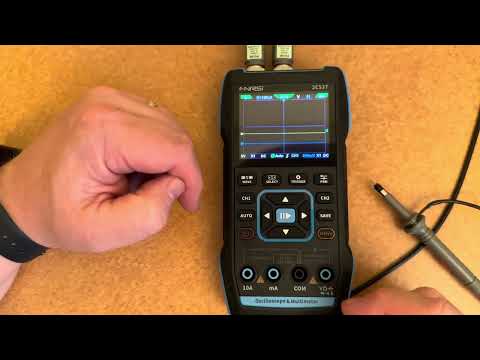
Roger Green demonstrates how to use the NDSU ECE 211 three-in-one meter as a two-channel oscilloscope and function generator. He measures a 5 V resistor divider, configures probe scaling, DC coupling, display scales, and automatic measurements, then drives the divider with a 2.5 V peak-to-peak, 1.25 kHz sine wave and compares both channels.
Key takeaways
- A 1 kΩ and 2.2 kΩ voltage divider places about 68.6% of the input across the 2.2 kΩ resistor, predicting approximately 3.43 V from a 5 V supply.
- The scope's probe factor must match the physical probe's 1× or 10× setting, and DC measurements require DC coupling.
- Two-channel comparisons are clearest when both probe grounds share circuit ground and both traces use aligned reference levels and the same vertical scale.
- The meter's automatic Vmax measurement gives about 5.0 V and 3.40 V for the DC divider, while VPP can include noise when measuring a DC trace.
- The function generator can produce a 2.5 V peak-to-peak sine wave at 1.25 kHz, but its limited output current causes the loaded input to fall to about 2.4 V peak-to-peak.
- With the sine wave driving the divider, the measured 1.67 V peak-to-peak output tracks the input at roughly the expected 68.6% ratio.
Chapters
- The oscilloscope plots probe voltage vertically against time horizontally, with a graticule of four divisions above and below the center crosshair.
- The example divider uses a 5 V supply, a 1 kΩ resistor, and a nominal 2.2 kΩ resistor.
- The midpoint should measure about 68.6% of the supply, or approximately 3.43 V.
- The meter has two oscilloscope inputs; Channel 1 is the left BNC connector, and each probe locks with a twist.
- Both probe ground leads connect to circuit ground, while the probe tips measure the supply and divider midpoint.
- Set the scope's probe factor to match the probe's 1× or 10× switch, or displayed voltages will be scaled incorrectly.
- Change both channels from AC coupling to DC coupling to retain the constant voltage levels in the divider circuit.
- AC coupling removes the DC component, which can help reveal a small oscillation riding on a large DC offset.
- Use the channel selector and V/H controls to adjust each trace's vertical scale and position independently.
- Connect Channel 1 to the 5 V rail and Channel 2 to the node between the 1 kΩ and 2.2 kΩ resistors, with both grounds at circuit ground.
- At 1 V per division, position the ground references together so the two DC levels can be compared on the same scale.
- The traces indicate about 5 V on Channel 1 and a little over 3 V on Channel 2, consistent with the predicted 3.43 V.
- The selectable green measurement cursor can be moved onto a trace to estimate its voltage, producing readings near 4.96 V and 3.3 V.
- The parameter menu offers measurements including VPP, frequency, and Vmax; enabling the display shows selected results alongside the traces.
- Vmax reads about 5.0 V on Channel 1 and 3.40 V on Channel 2, while peak-to-peak is less useful for a nominally DC signal with minor noise.
- Long-press the meter's third top button to open the function generator, then select a sine waveform.
- Set the frequency to 1,250 Hz and the amplitude to 2.5 V peak-to-peak using the digit controls.
- The built-in generator supports several waveform shapes but is limited to roughly 3 V peak-to-peak and supplies little current.
- Connect the generator output to the divider in place of the 5 V supply, and connect the generator and probe grounds to the same circuit ground.
- Set both channels to 500 mV per division and align their ground references; adjust the trigger level into the signal range for a stable trace.
- Automatic readings show about 1.25 kHz, 2.4 V peak-to-peak at the input, and 1.67 V peak-to-peak across the 2.2 kΩ resistor, close to the divider's 68.6% ratio.
- Adjust the horizontal time scale to show a few waveform cycles; too wide a window obscures the signal, while too narrow a window can prevent stable triggering.
Transcript excerpt
0:02 Welcome to the issue EC211. This is the fifth lab video. What I'd like to try to do in this video is talk a little bit more about our 3 in1 meter. Um we're going to look at its oscilloscope function as well as its function generator functions. U those are needed for the upcoming lab and just want to make sure everybody knows how to use them. So we got our meter. I'm going to go ahead and turn it on. Uh I'm keeping the light in the room a little bit darker than my previous video. see if we can get rid of some of the glare. When it first fires up and lets you change settings, it'll give you an ability to scroll between different options here. Uh you can have your multimeter, you can have settings, you can have signal generator, and you can have oscilloscope. We're going to just uh go ahead and go to the oscilloscope. And so I'm going to click into that one. And um
0:50 depending on how things are set, you might not see something exactly like this. Um but it's very likely you'll have a couple of lines showing in here. The oscilloscope provides a way of visualizing voltages on the scope probes. I don't have anything attached yet. I don't have probes I don't have probes up here on the top of the of the device. We'll put those in in a minute. Um, but it gives us an ability to see the voltage on those probes as a function of time. So, we got time going along the horizontal axis. We've got voltage going along the vertical axis. This display is pretty nice. It's a color display, but it does have some really faint lines in there. There's a
This is the start of the transcript. Save this video free for the whole transcript, searchable and time-coded.
Related notes
Summary, takeaways, and chapters were generated by AI from the video's transcript and may contain errors. The video belongs to its creator, Roger Green.