Lec13 Chp4 M2001 Summer26 Graphs of Tangent, Inverse Trig Function
 Watch on YouTube →
Overview
Shahera Jannah reviews sine and cosine graph transformations, then contrasts tangent graphs and introduces inverse trigonometric functions. The lesson emphasizes how to calculate period, phase shift, amplitude, and extrema, and how the principal ranges of arcsine, arccosine, and arctangent determine valid angle answers.
Key takeaways
- For sine and cosine, one-cycle graphing is systematic: compute the period 2π/|b|, shift the cycle endpoints by c/b, and use midline d with extrema d±|a|.
- Tangent uses period π/|b| rather than 2π/|b|, has vertical asymptotes, excludes those x-values from its domain, and still has all real numbers as its range.
- The principal ranges determine inverse-trig answers: arcsine uses [−π/2,π/2], arccosine uses [0,π], and arctangent uses (−π/2,π/2).
- Arcsine and arccosine accept only inputs in [−1,1]; a value outside that interval, such as 7, has no real inverse-trig output.
- Inverse notation is not reciprocal notation: sin⁻¹(x) means arcsine, while 1/sin(x) is the reciprocal function cosecant.
- For parity sums, even plus even stays even and odd plus odd stays odd, but mixed-parity sums and odd functions plus a nonzero constant generally require checking f(−x).
Chapters
- For sine and cosine, amplitude is the absolute value of the coefficient a, and period is 2π/|b|.
- The phase shift is c/b, with the direction opposite the sign inside the function; d sets the midline y=d.
- The maximum and minimum are d+|a| and d−|a|, respectively.
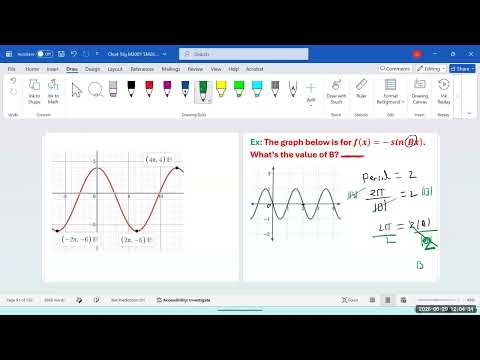
- The example has amplitude 5 and midline y=−1, so its maximum is 4 and its minimum is −6.
- With b=1/2, the period is 2π/(1/2)=4π, giving a cycle from x=0 to x=4π.
- Mark quarter-period points at 0, π, 2π, 3π, and 4π, then draw the cosine cycle from a maximum.
- For a sine graph with one period spanning 2 units, set 2π/|b|=2.
- Solving gives |b|=π, so a matching sine model uses sin(πx).
- A period may be a plain number when b contains π, or contain π when b is a plain number.
- For the example with amplitude 4 and an inside term x+π, c/b=π, so the graph shifts π units left.
- Its period is 2π, so the shifted one-cycle interval runs from −π to π.
- The graph has maximum 4 and minimum −4; use the shifted endpoints and cosine's starting shape to choose the matching graph.
- The example has amplitude 4/5, midline y=0, and period 4π.
- Its phase shift is π/2 to the right, moving the base interval [0,4π] to [π/2,9π/2].
- The maximum is 4/5 and the minimum is −4/5; the positive cosine cycle starts high and ends high.
- Unlike sine and cosine, tangent has vertical asymptotes and repeats every π/|b|.
- The coefficient a controls horizontal stretching or compression, while d still gives the midline y=d.
- For the basic tangent graph, the domain excludes its vertical asymptotes and the range is all real numbers.
- For the example with b=π/2, the tangent period is π/(π/2)=2.
- The phase shift is one unit left, so identify the graph segment positioned around x=−1.
- Compare the period and shift, then check whether the graph is wider or narrower; a π label on the horizontal axis would not match this example.
- Adding two odd functions gives an odd function, and adding two even functions gives an even function.
- An even function plus a constant remains even, while an odd function plus a nonzero constant is generally neither.
- A sum of an even and an odd function is usually neither, so verify it using f(−x) when uncertain.
- Cosine and x² are even; sine, tangent, and x⁵ are odd.
- The lesson classifies eˣ as neither because it is not symmetric about the y-axis or the origin.
- Mixed examples such as an odd function combined with eˣ are neither; show the parity rule or test f(−x) to justify the result.
- A short rest is announced after the parity exercises, followed by a return to inverse trigonometric functions at about 60:07.
- The transcript contains an extended pause between the graph and inverse-trig sections.
- A regular trig function takes an angle and returns a side ratio; an inverse trig function takes a ratio and returns an angle.
- For a right triangle with two side lengths known, use the corresponding ratio inside arcsine, arccosine, or arctangent to find an angle.
- The sine inverse, cosine inverse, and tangent inverse are the three inverse functions emphasized for the course.
- Arcsine has domain [−1,1], since real sine values cannot fall outside that interval.
- Its principal range is [−π/2,π/2], corresponding to the right half of the unit circle.
- The endpoints are included because sine reaches −1 and 1 at −π/2 and π/2.
- Arccosine has domain [−1,1] and principal range [0,π].
- That range covers the upper half of the unit circle, including angles 0 and π.
- The restricted range ensures that each valid cosine input maps to one principal angle.
- Arctangent accepts every real number as input, so its domain is (−∞,∞).
- Its range is (−π/2,π/2), with open endpoints because tangent is undefined at ±π/2.
- Like arcsine, arctangent's principal angles lie on the right half of the unit circle, but the endpoints are excluded.
- The notation sin⁻¹(x) means arcsine, not the reciprocal of sine.
- The reciprocal function is 1/sin(x), also called cosecant; parentheses and exponent placement distinguish the two meanings.
- Regular trig returns a side ratio from an angle, while inverse trig returns an angle from a ratio.
- The example arccos(√3/2) returns π/6, or 30°, because cosine is √3/2 at that principal angle.
- For arccos(−√3/2), choose 5π/6, or 150°, rather than −30° because arccosine's range is [0,π].
- Select the answer using the inverse function's principal range, not just the reference angle.
- Arcsine and arccosine accept inputs only from −1 to 1; values such as 7 or 8 are outside their real domains.
- Arcsin(1)=π/2, and arccos(0)=π/2; although cosine is zero at both π/2 and 3π/2, only π/2 is in arccosine's range.
- Use the principal range to select a single output whenever the unit circle contains multiple angles with the same trig value.
- Tangent is opposite over adjacent, so arctan(1)=π/4, or 45°.
- The examples with positive and negative √3 produce π/3 and −π/3, both within arctangent's range (−π/2,π/2).
- Arctan(0)=0; its principal angle is selected from the right-half-circle range.
- The closing example uses a zero tangent ratio to identify the principal angle 0°.
- The course grading weights are stated as 10% homework, 9% quizzes, 51% exams, and 30% final.
- A grade calculator is mentioned as a way to estimate the score needed on remaining coursework.
Transcript excerpt
0:11 computer. Okay. So in our last one, the last thing we did was graphing of a sign function and we said for s and cosine. Let's go back to all the information >> and five. uh chapter five has two section and chapter four has three sections. So five sections. Okay. So for s and cosine we
1:02 have uh the first number in our equation is amplitude. It means how high our graph is. And then they have period of 2 pi / b. The phase shift means the left right shifting is C over B. If this C over B is positive, it goes to the left. If it's negative, it goes to the right. And the D, the up down shifting is called midline. It means exactly the middle line of your sign and co. No. Oh, the maximum and minimum uh the maximum is the midline plus the amplitude and the minimum is the midline
1:51 minus the amplitude. So we drew one graph in our last class actually two graphs and now let's draw one graph for cosine. But first let's find let's identify all the information. Amplitude. What's the amplitude for our cosine graph here? Five. It means from the midline it will go five unit up 5 unit down. So what is our midline? D the midline. Y =1. So from -1 it will go 5 units up from -1 it will go 5 units down. So our maximum value will be d + a which the
2:44 absolute value of a. So -1 + 5 what do you get? four >> four and the minimum value will be d minus absolute value of a mean -1 - 5 which will be >> -6. So we can draw the graph here at the same time. Cosine graph starts from the top goes
This is the start of the transcript. Save this video free for the whole transcript, searchable and time-coded.
Related notes
Summary, takeaways, and chapters were generated by AI from the video's transcript and may contain errors. The video belongs to its creator, Shahera Jannah's Math World! 😁😎.