3.5 Relations and Functions --Lesson 13--FA26
 Watch on YouTube →
Overview
Rachel Soyk teaches how to describe relations using ordered pairs, domain, and range, then determine whether a relation is a function by checking for repeated inputs or applying the vertical line test. She connects function notation to inputs and outputs, demonstrates evaluating and transforming functions, and applies the ideas to a model of unread emails growing by 10 per day.
Key takeaways
- A relation is a function precisely when each input x has one output y; multiple different inputs may share the same output.
- The vertical line test is the graphical version of checking for repeated x-values: any vertical line intersecting a graph more than once proves it is not a function.
- Solving an equation for y can expose its graph and function behavior: y = x² + 1 passes the vertical line test, while a sideways parabola does not.
- Function notation f(x) identifies the output associated with input x, and evaluating it requires substituting the input in parentheses before applying order of operations.
- The model n(t) = 75 + 10t starts at 75 unread emails and adds 10 each day, predicting 125 unread emails after five days.
Chapters
- A relation can be represented as a set of ordered pairs, with each point written in (x, y) form.
- The domain contains the graph's x-coordinates and the range contains its y-coordinates; Soyk lists numerical values from least to greatest.
- For a sample graph, the domain is {-3, 0, 1, 2, 4} and the range is {-2, 3, 4, 5}.
- A relation is a function when each unique x-value is paired with exactly one y-value; repeated y-values are allowed.
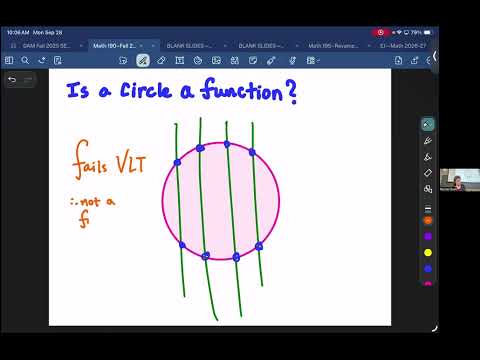
- On a graph, a relation passes the vertical line test if every vertical line intersects it at no more than one point.
- A circle fails the test because a vertical line through it generally intersects at two points.
- A function whose outputs are also unique is one-to-one and passes both vertical and horizontal line tests.
- For a set of ordered pairs, check whether any x-coordinate repeats; distinct x-values mean the relation is a function.
- The example relation has domain {-3, -2, -1, 0, 1, 2, 3} and range {0, 1, 8, 27}.
- In a mapping of names to phone numbers, Lydia and Marty each connect to multiple numbers, so the relation is not a function.
- A relation can still have a domain and range even when it is not a function.
- Rearranging 2x + y = 7 into y = -2x + 7 reveals a linear function.
- The equation y = x² + 1 is a vertically shifted quadratic and passes the vertical line test.
- When y is squared instead of x, the resulting sideways parabola fails the vertical line test.
- Soyk reviews the shapes of x², √x, and eˣ; e is approximately 2.718, and exponential curves have a y-intercept at (0, 1).
- Function notation f(x) names the output for an input x; the parentheses indicate notation, not multiplication.
- The domain and independent variable describe inputs, while the range and dependent variable describe outputs.
- A coffee example illustrates an 18-ounce input producing a 36-ounce output under a 1:2 ratio.
- Soyk emphasizes that an output depends on the chosen input, while the input is treated as independent.
- To evaluate a function, replace every occurrence of its variable with the input inside parentheses, then apply order of operations.
- For f(x) = 3x² + 2x - 5, substituting x = 2 gives f(2) = 9.
- For f(x) = 2x² + 3x - 1, the worked examples give f(3) = 26 and f(-2) = 1.
- Replacing x with a symbol such as a gives f(a) = 2a² + 3a - 1 without numerical simplification.
- For g(x) = 3x - 5, substituting h² gives g(h²) = 3h² - 5, while substituting x + 2 gives g(x + 2) = 3x + 1.
- Evaluating g(2) gives 1, so combining it with g(x) produces g(x) + g(2) = 3x - 4.
- Sylvia's unread email count is modeled by n(t) = 75 + 10t, where t is time in days and n is the number of unread emails.
- After five days, n(5) = 125, meaning Sylvia has 125 unread emails.
Transcript excerpt
0:03 All right. Can we have a volunteer? Yeah. What's your name? >> Deb. All right. Go for it. >> Yeah. Another way that addition can be represented. The set of ordered pairs of all the points plotted is the relation. The set of all y x coordinates is the domain of the relation. The set of all y coordinates is the range. Generally, we write the in ascending order for both the domain and range of >> beautiful. Awesome. So, we're going to be identifying domain and range a lot over these next few examples. Now, obviously, if we're looking at it as the ordered pairs, you can't always necessarily write them in ascending order um for both our x and y values cuz
0:54 maybe you'll have a lower x value but a higher y value. um compare comparing ordered pairs. So what we like to generally do in those circumstances is choose like the xcoordinate points and then put those in ascending order. So if the y's are a little out of order, it's not the end of the world. But okay, let's move into our third example which we are being asked to use this graph of the relation list the ordered pairs find the domain and then find the range. So for part a ordered pairs what is
1:42 um a -3 to 4. Good. What about B? 03. What about C? Um I think it's five. Yeah, no worries. D31, E 2 -2, and last but not least, F. Yeah, beautiful. So those are all of our ordered pairs. And because we're listing it as a set, um, we have those squiggly brackets. We have each of the ordered pairs in that xycoordinate point form inside parenthesis.
2:30 And then each one is separated by a comma. Part B is now just asking to find the
This is the start of the transcript. Save this video free for the whole transcript, searchable and time-coded.
Related notes
Summary, takeaways, and chapters were generated by AI from the video's transcript and may contain errors. The video belongs to its creator, Rachel Soyk.