Kinetics and Reaction Mechanisms 1412 2026 L15
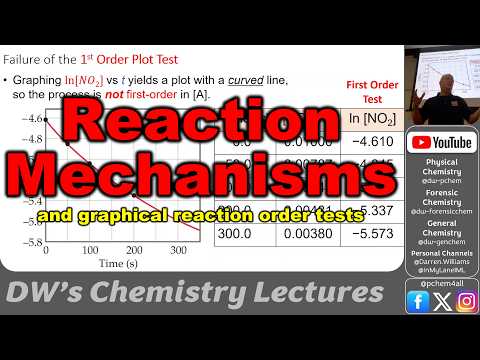 Watch on YouTube →
Overview
The lecture shows how a single time-series experiment can identify zero-, first-, or second-order kinetics by testing whether concentration, ln(concentration), or its reciprocal forms a straight line against time. It also connects activation energy to reaction rates through the Arrhenius equation and Maxwell-Boltzmann energy distributions, then introduces reaction mechanisms, molecularity, and catalysts such as catalytic-converter surfaces, enzymes, and chlorine in ozone destruction.
Key takeaways
- A single concentration-versus-time experiment can identify common reaction orders: [A] versus time for zero order, ln[A] versus time for first order, and 1/[A] versus time for second order.
- First-order half-life, t1/2 = ln(2)/k, is independent of initial concentration, while second-order half-life, 1/(k[A]0), and zero-order half-life, [A]0/(2k), depend on initial concentration.
- On a reaction-coordinate diagram, activation energy is measured from a reactant to the transition-state peak, while whether a reaction is exothermic or endothermic depends on the relative energies of reactants and products.
- The Arrhenius plot of ln(k) against 1/T has slope -Ea/R, and higher temperature increases the fraction of molecules able to cross the activation-energy barrier.
- Catalysts provide an alternative reaction pathway or improve productive encounters, but they are regenerated rather than consumed; chlorine in ozone destruction and enzymes are examples.
- A 10 °C temperature increase often approximately doubles a reaction rate, but this rule of thumb can fail when temperature changes the mechanism or physical state.
Chapters
- Integrating the first-order rate relationship gives ln[A]t = -kt + ln[A]0, which predicts reactant concentration at any time.
- For a first-order process, plotting ln[A] against time produces a line with slope -k.
- Concentration measurements may use units such as molarity, grams, or molecule counts, provided the measurements remain proportional to the amount of reactant.
- Create a column of natural-log concentrations and plot it against time; a linear result supports first-order kinetics.
- The negative slope of the ln[H2O2] versus time plot gives the first-order rate constant.
- Fitting all five time measurements gives a more reliable estimate of k than calculating it from only two data points.
- Methyl isocyanide rearranges to acetonitrile; the reaction-coordinate diagram represents the energy change as the molecule changes structure.
- The diagram's peak is the transition state, and activation energy is the energy gap between a reactant and that peak.
- The products lie lower in energy than the reactants, so the forward isomerization is exothermic; the reverse process is endothermic and has a higher activation barrier.
- A plot of ln(pressure) against time for methyl isocyanide gives a straight line, indicating first-order behavior and a reported rate constant of 5.1 × 10^-5 s^-1.
- For a second-order reaction in A, plotting 1/[A] against time gives a straight line with slope k.
- In the nitrogen dioxide decomposition example, ln[NO2] against time is not linear, while 1/[NO2] against time is linear, identifying a second-order process.
- The second-order half-life is t1/2 = 1/(k[A]0), so it depends on both the rate constant and the initial concentration.
- A zero-order reaction has rate = k and an integrated concentration relationship [A]t = [A]0 - kt.
- A straight-line plot of [A] against time indicates zero-order kinetics, with slope -k.
- To distinguish orders, test [A] versus time first, then ln[A] versus time, then 1/[A] versus time; the linear plot identifies zero-, first-, or second-order behavior.
- For the butadiene dimerization example, the first-order plot fails and the second-order plot passes.
- The Maxwell-Boltzmann distribution describes the spread of molecular kinetic energies; raising temperature increases the fraction of molecules above the activation-energy barrier.
- The Arrhenius equation, k = A e^(-Ea/RT), explains why the rate constant generally rises as temperature increases.
- Plotting ln(k) against 1/T gives a straight line with slope -Ea/R, allowing activation energy to be determined from measurements at multiple temperatures.
- Temperature-dependent cricket chirp pitch and firefly flashing frequency were used as biological signals of reaction speed.
- The examples report activation energies near 12 kcal/mol for cricket and firefly processes, and about 24 kcal/mol for human time-estimation responses.
- Turtle heartbeat measurements illustrate that the apparent activation energy can change at lower temperatures, where different biological processes may become important.
- These plots use ln(rate-related measurements) against reciprocal temperature to examine temperature dependence, not to identify reaction order.
- A common kinetics rule of thumb is that increasing temperature by 10 °C approximately doubles the rate of many reactions.
- Under this approximation, a reaction taking 60 minutes would take about 30 minutes after a 10 °C increase.
- The rule is not universal: it may fail if a large temperature change alters the reaction mechanism or causes a phase change.
- A reaction mechanism is the sequence of molecular events through which reactants become products.
- Molecularity describes how many particles participate in an elementary event; some processes involve two molecules, a third-body collision, or interaction with container walls.
- Collision orientation matters: carbon monoxide and oxygen form carbon dioxide only when they meet in a productive arrangement.
- Temperature, mixing, and collision direction affect how often effective collisions occur and therefore influence reaction rates.
- Catalytic-converter surfaces hold reactants such as carbon monoxide and oxygen in place, reducing a three-dimensional collision problem to surface reactions.
- Enzymes bind substrates at specific sites, facilitate reactions such as substrate splitting, and are regenerated rather than consumed.
- Chlorine acts as a homogeneous catalyst in ozone destruction: it reacts with ozone and is regenerated in a later step.
- A heterogeneous catalyst is in a different phase from its reactants, as with a solid converter and gaseous pollutants; a homogeneous catalyst shares their phase, as gaseous chlorine does with ozone.
Transcript excerpt
0:01 Yeah. So today we're talking actually about react reaction mechanisms and then we're look at learning a way to test if something's first or second order or zeroth order from a single experiment. So in the previous lecture we had to do multiple experiments to determine if it was first order or second order in a you know we did the the initial rates and then how it changed with um the concentration of something and then we simplified the equation and figured out okay like two raised to some power was equal to eight. So we figured out that that power was three but that requires multiple experiments. Okay. Uh this is a way to learn if it's zero first or second order um with just a single experiment. We just monitor the concentration over time and we see how it changes and if it drops off say
0:49 really fast or really slow or whatever. We take the log of things we can determine if it's first or or second order or zeroth order. Okay. So this is the order of reaction test plot. So this is an interesting way to do things too. It's a it's um like last time you you had multiple rows in this table of different experiments and you could just do it algebraically and that was pretty concrete. Um of course we gave you simple ones where things were doubled and then it went up by eight or or something like that. It it may not always be that clearcut but this is a this is a different way to test things. It's a graphical test and so we'll learn about that. We're going to do a lot of work on activity uh the activation energy. So, how we can get a reaction to
This is the start of the transcript. Save this video free for the whole transcript, searchable and time-coded.
Related notes
Summary, takeaways, and chapters were generated by AI from the video's transcript and may contain errors. The video belongs to its creator, DWs General Chemistry Videos.