IEE 475: Lecture K1 (2026-11-17): Variance Reduction Techniques, Part I (CRNs and Control Variates)
Overview
Ted Pavlic reviews confidence-interval methods for comparing simulation systems, then explains how to control familywise error and choose among multiple alternatives using Bonferroni comparisons, benchmark tests, ANOVA post hoc tests, and ranking-and-selection tools. The lecture introduces variance reduction through Common Random Numbers (CRNs): using matched random inputs makes system outcomes positively correlated, reducing the variance of paired differences; control variates are deferred to the next lecture.
Key takeaways
- For two simulation systems, test the confidence interval on their mean difference against zero; comparing separate point estimates can mistake random variation for a real improvement.
- All-pairs ranking among k systems requires k(k−1)/2 comparisons, so Bonferroni correction can sharply reduce power; benchmark screening needs only k−1 comparisons when the benchmark is the sole reference.
- Post hoc letter groupings are read by shared letters: systems with at least one common letter are not significantly different, while groups with no shared letters are distinguishable.
- Arena’s Process Analyzer supports parameter sweeps and ranking-and-selection using a practical difference threshold, while OptQuest searches for an optimum under constraints.
- Common Random Numbers pair corresponding inputs across systems; when those paired outcomes are positively correlated, the variance of their differences falls and small performance effects become easier to detect.
- In the queueing example, matching inputs across 15 arrival schedules showed that two slower servers could produce lower waiting times than one fast server, despite an independent-sample test failing to distinguish them.
Chapters
- Lab 10 remains available without penalty through the upcoming weekend and offers 20 bonus points; one part uses a provided model, while the other is built from the text.
- The final project presentation and report are due Wednesday of the last week of class, with peer reviews due Saturday.
- Presentations must stay within 10 minutes; the report has a four-page main-content limit, with the full model allowed in an appendix.
- Ted Pavlic cautions against comparing point estimates, such as simulated wait times of five versus three minutes, without accounting for uncertainty.
- A confidence interval’s width depends on data variance and sample count, so it can be narrowed by collecting more replications or reducing variance.
- A 95% confidence interval contains the true mean in 95% of repeated samples; choosing 90% instead reflects a more permissive stance on Type I error.
- Relative comparisons are often easier to defend than estimating one system’s absolute performance, because absolute claims require strong real-world calibration.
- A two-sample confidence interval estimates the difference between systems; if it includes zero, the results do not establish a difference.
- If the interval excludes zero, the systems differ at the chosen confidence level, and the difference’s sign indicates which system performs better.
- Paired experiments produce one difference per matched block, which can be analyzed with a one-sample t-test on the differences.
- Independent samples are commonly shown with separate boxplots or confidence intervals and a bracket or p-value indicating the two-sample test result.
- When reporting paired comparisons, the confidence interval on the mean difference is more informative than the point estimate alone.
- Ranking and selection (R&S) aims to order several candidate systems, such as staffing configurations with specialized or cross-trained operators.
- Comparing every pair among k systems requires k(k−1)/2 tests; five systems require 10 comparisons, while 10 systems require 45.
- Each pairwise test has its own Type I error, so many comparisons make false discoveries increasingly likely.
- Bonferroni controls the overall error rate by dividing alpha across the pairwise comparisons; for 10 systems and 45 pairs, each test receives alpha/45.
- A very small per-test alpha produces wider confidence intervals, making real but modest system differences harder to detect.
- The Output Analyzer can display all pairwise intervals and apply Bonferroni correction, but the resulting comparisons may have low power.
- If the goal is to screen candidate designs against a real-world benchmark, compare each candidate only to that benchmark rather than ranking every pair.
- For 10 total systems, benchmark screening requires nine comparisons instead of 45, so Bonferroni correction is less severe.
- This approach identifies candidates that are better, worse, or indistinguishable from the benchmark without ordering all candidates.
- ANOVA tests whether any differences exist among several systems, and post hoc procedures identify which pairs differ.
- Fisher’s LSD follows an ANOVA; Tukey’s HSD can be run directly and does not require a preceding ANOVA.
- In post hoc letter groupings, systems sharing at least one letter are not statistically distinguishable; groups with no shared letters differ significantly.
- ANOVA is useful when the data meet its assumptions and all observations are ready for one analysis, but it is not designed for sequentially adding samples.
- Sequential sampling is useful when pilot results determine whether more replications are needed, unlike a single end-of-study ANOVA.
- An R&S procedure begins with a pilot of at least 10 replications per candidate and a stakeholder-defined practical threshold, epsilon.
- The procedure screens candidates with pairwise comparisons, allocates further replications to survivors, and selects a system designed to be within epsilon of the best at the target confidence level.
- Arena’s Process Analyzer can vary model parameters, such as testing cashier counts from six to 10, and run the R&S procedure automatically.
- Users specify whether high or low performance is best and set epsilon, the practical difference that matters to the stakeholder.
- Its results may show only two groups: candidates within epsilon of the best and candidates screened out.
- Arena’s OptQuest uses black-box optimization heuristics to search simulation controls, optimize a selected response, and respect user-defined constraints.
- Controls can have different domains, such as integer values from 0 to 10 or continuous values from −6 to 2.5.
- OptQuest explores feasible settings and reports a best solution found; unlike the Process Analyzer, its focus is optimization rather than presenting an R&S grouping.
- The Output Analyzer imports Arena output or CSV data and supports one-system intervals, two-system tests, pairwise comparisons, and ANOVA.
- Its plots can be copied or exported as PNGs for statistically supported reporting.
- A post hoc group labeled ACE differs from a single-letter group labeled B or D, because those groups share no letter.
- Confidence-interval standard error scales with the response standard deviation divided by the square root of the replication count.
- Variance reduction techniques seek to reduce the numerator by designing experiments that control or account for sources of randomness.
- The lecture introduces CRNs and control variates as the first two techniques, but covers CRNs here and leaves control variates for the next lecture.
- Arena changes random-number seeds between replications to generate independent runs; CRNs assign matching seeds across competing systems within each replication.
- In practice, streams should be tied to specific input sources, such as arrivals and service times, so both systems receive the same corresponding inputs.
- Matching inputs creates paired blocks, allowing each replication’s system outputs to be compared through a difference.
- The muffin example compares greedy baking with a nearly-full policy that waits for at least 20 muffins before loading the oven.
- Pairing the same 10 muffin-arrival schedules across both policies shows nearly-full baking has a higher time in system across the schedules.
- Analyzing within-schedule differences controls for schedule difficulty and can exclude zero even when unpaired results have substantial overlap.
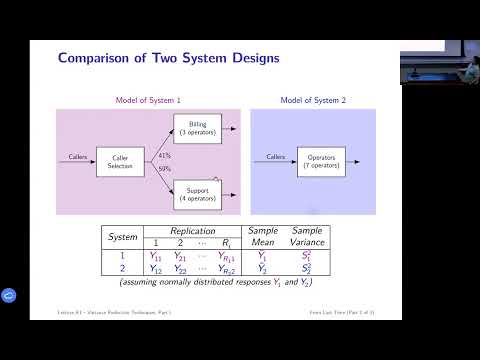
- The queueing example compares one fast server with two slower servers using the same customer arrivals and service-time inputs.
- An independent Welch confidence interval includes zero, but pairing the systems by arrival schedule reveals a consistent difference.
- Across 15 arrival schedules, the two-slower-server system has lower waiting time; positive correlation between paired outcomes reduces the variance of their differences.
Transcript excerpt
0:03 All right. Appreciate it. Okay. So, um I think uh I didn't mention the lab in here, but as um online, like I said, I was giving extra time for the lab. So, technically I wanted to I set the lab due date for this past weekend to encourage you to get it done so you could spend the rest of the lab times working on your final project. But that [clears throat] lab 10 is available with no penalty until this upcoming weekend so that you can take advantage of that as bonus points. So it's 20 extra points. So that's basically, you know, labs are out of 30. So it's almost a whole second lab. I think those are the last bonus points for the semester. So if you're looking for, you know, something to help with and a labs are the good fraction of your grade. So 20% uh bonus on a lab can help you know that
0:53 it gets scaled by the percentage of the category adding to your uh your your class grade. So um hope you take advantage of it or at least take a look at it. Um there's two parts. Um but one of them I give you a model lab or model to work with. The other one you're kind of going to build from scratch by reading through the text and just read through those sections and it'll tell you all the parameters that you need. So, lab 10 is out there. I didn't have mention the announcements here because technically again, I'd rather you be working on your final projects now, but if you wanted to give Angela those bonus points, they're available until this upcoming weekend. Um, otherwise, there's an A. Um, this is the last kind of
This is the start of the transcript. Save this video free for the whole transcript, searchable and time-coded.
In this course
Related notes
Summary, takeaways, and chapters were generated by AI from the video's transcript and may contain errors. The video belongs to its creator, Ted Pavlic.