IEE 475: Lecture J1 (2026-11-03): Est. of Abs. Perf. I (Intro. to Point & Interval Estimation)
 Watch on YouTube →
Overview
Ted Pavlic introduces point and interval estimation for simulation performance, connecting t tests, statistical power, and confidence intervals to the design of simulation experiments. He explains paired differences for shared-input comparisons, Bonferroni correction for multiple outputs, and how replication, batching, and warm-up bias affect whether simulation data support valid inference.
Key takeaways
- Use a paired-difference t test when a real system and its simulation share historical inputs: subtract each matched pair and test whether the differences have mean zero.
- For five independent output comparisons with a desired 5% familywise error rate, the Bonferroni procedure sets each test's alpha to 1%.
- Choose replication counts using power analysis: standard error falls as the number of independent replications rises, while the underlying standard deviation remains unchanged.
- Do not count correlated customers or time-series observations within one simulation run as independent samples; aggregate them into batches or use one summary per independent replication.
- Discard warm-up observations when estimating steady-state performance for non-terminating systems, because low start-up values can bias the long-run estimate downward.
- A t test requires independent observations and normally distributed data for its exact parametric interpretation; alternatives such as Mann-Whitney U or Kruskal-Wallis may be needed when assumptions fail.
Chapters
- The input modeling report deadline moved to Wednesday night because of heavy rain affecting data collection.
- Lab 9 covers Arena's Output Analyzer; Ted Pavlic recommends the course Output Analyzer, which also reads Arena DAT files and supports confidence intervals, t tests, and ANOVAs.
- A dual-topic lab is planned for next week with 20 bonus points available, followed by two open lab periods for final project work.
- Final reports and presentation videos are due Wednesday of the last class week, with peer reviews due Saturday.
- An ROC curve plots false-positive rate against true-positive rate, where statistical power equals one minus the false-negative rate.
- The course generally uses alpha = 0.05 and targets at least 80% power, though applications may choose different thresholds.
- A one-sample t statistic standardizes the difference between a sample mean and a hypothesized population mean.
- A t test requires independent observations and, for the course's exact treatment, normally distributed data.
- For a one-sample t test with n observations, degrees of freedom equal n minus one.
- Low-degree-of-freedom t distributions have fatter tails than the normal distribution; as degrees of freedom increase, the t distribution approaches the normal.
- The course uses two-sided tests, so a 5% total error rate allocates 2.5% to each tail.
- A one-tailed critical-value table must be used with care because its listed tail probability differs from the 5% two-sided test.
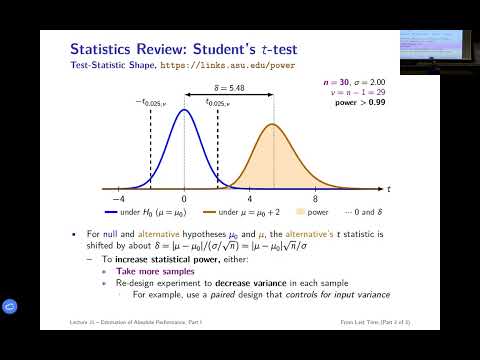
- The noncentral t distribution represents results when the true mean differs from the null mean, while the central t distribution represents the null case.
- Overlap between the distributions creates false positives and false negatives; increasing sample size or reducing variance separates them and raises power.
- The standardized separation grows with the mean difference times the square root of sample size, divided by the data standard deviation.
- Choosing replication counts by power analysis avoids experiments with inadequate power, such as the example with only about 30% power.
- A real bank and its simulation may receive the same historical customer inputs, such as the same Monday-through-Friday arrival and demand data.
- Because the outputs are coupled by shared inputs, a two-sample t test incorrectly treats the real and simulated measurements as independent.
- Statistical blocking pairs each real output with its corresponding simulated output and computes a difference for each input block.
- Validation then becomes a one-sample t test of whether the paired differences have mean zero.
- For paired differences, calculate their mean and unbiased sample variance using a denominator of k minus one.
- The one-sample test statistic is the mean difference divided by its sample standard deviation over the square root of k.
- Use the stakeholder's tolerated difference in real units divided by the pilot standard deviation to obtain a standardized effect size.
- For the stated target of 80% power and 5% false-positive rate, use the one-sample t-test operating-characteristic curve to select the required sample count.
- The t test and ANOVA are parametric tests that assume normally distributed data and make inferences about means.
- The Mann-Whitney U test is a nonparametric alternative for two groups, while the Wilcoxon signed-rank test handles paired differences.
- The Kruskal-Wallis test provides a nonparametric alternative to ANOVA for multiple groups.
- A chi-square test requires at least five expected observations in every bin; exact multinomial or binomial tests can be alternatives but may be computationally slower.
- Testing many response measures independently at alpha = 0.05 raises the chance of finding at least one false difference.
- For k independent tests, the familywise error rate is 1 minus (1 minus alpha) raised to the k.
- Correlated measures can represent several manifestations of one system change, but they do not remove the multiple-testing false-positive problem.
- The issue arises when a simulation is judged different from a baseline if any one of several output tests rejects.
- The Bonferroni method divides the desired familywise alpha by the number of comparisons, so five tests targeting 5% use 1% alpha each.
- In Ted Pavlic's five-output demonstration, running each test at 5% produced a 22% familywise false-difference rate across 100 trials.
- Using alpha = 0.05 divided by five reduced false detections to five of the 100 trials in the demonstration.
- For engineering screening, higher false-positive rates may sometimes be tolerated if follow-up experiments verify findings; applications such as medicine often require tighter control.
- A terminating system has a meaningful real-world end condition, such as a bank operating from 8:30 a.m. to 4:30 p.m.
- Transient simulations preserve start-up behavior because it is part of the system being studied.
- A non-terminating system, such as a 24-hour grocery store or emergency room, has no meaningful operating end time.
- Steady-state simulation discards the initial warm-up period; including low start-up observations can bias the estimated long-run performance downward.
- A 5,000-minute run can be divided into batches, such as successive 1,000-minute sections, to examine changes over time.
- Different random-number seeds create independent replications, while batches within one run may remain dependent.
- Low early batch averages and higher later averages can indicate that start-up transients have not yet disappeared.
- In the notation y with two subscripts, the first identifies the replication and the second identifies the batch within that replication.
- A point estimator, such as mean waiting time, uses simulation data to estimate an unknown performance parameter.
- A replication means rerunning the same model with a different random-number seed, producing one observation for analysis.
- Across independent replications, the sample mean's standard error is estimated as the population standard deviation divided by the square root of the replication count.
- Increasing the number of replications reduces standard error, but does not reduce the underlying population standard deviation.
- Customer waiting times within one run may be correlated, so 1,000 customers do not automatically constitute 1,000 independent samples.
- Aggregating dependent observations into sufficiently large batches can produce approximately independent batch averages; one average per replication is the conservative case.
- Treating correlated customer observations as independent is pseudo-replication and can invalidate standard errors and tests.
- The closing clicker question asks which quantity tends to zero as replications approach infinity: standard error, standard deviation, or both; the answer is standard error.
Transcript excerpt
0:01 Okay, happy uh election day to those who celebrate. Um we will I guess talk about confidence intervals today. So that's definitely relevant. Um so schedule for things uh and so the input modeling report um because at least traditionally we've had a lot of students go out and collect data from banks and restaurants things like that and a lot of times some you know Dutch Bros is very popular people would stand outside there and so the uh the the sort of near constant rain on a lot of the valley uh made me think well maybe it's a good idea to just postpone to Wednesday. So that's due tomorrow night, that input modeling report. Thanks for I think about half the class had already turned it in before I made that announcement. So appreciate your effort on that and sorry for the the late
0:49 change. I wasn't really thinking about the the weather uh issues. Um but so that you know if you'd like to make any updates that's fine. Um that will be due Wednesday night. So uh make sure to do that. Um so otherwise uh this week um you know we have now this lab nine which will be due this Sunday. Lab nine is on um the use of the output analyzer. So the lab as it's written is focused on Arena's output analyzer which you can use. Uh it's a tool that comes with Arena. Uh and uh it it loads these these proprietary DAT files that um Arena has and it's able to then do confidence intervals and t tests and ANOVAs and things like that. It's a little clunky uh and it's uh it's not the simplest thing to get data out of and I think to
1:38 navigate. And so, uh, what, um,
This is the start of the transcript. Save this video free for the whole transcript, searchable and time-coded.
Related notes
Summary, takeaways, and chapters were generated by AI from the video's transcript and may contain errors. The video belongs to its creator, Ted Pavlic.