IEE 475: Lecture J2 (2026-11-05): Est. of Abs. Perf. II (Terminating Systems/Transient Simulations)
Overview
Ted Pavlic explains how to estimate performance in terminating and transient simulations, emphasizing independent replications, bias control, and interval estimates rather than point estimates alone. He connects statistical tests and confidence intervals to practical simulation work in Arena, covering mean and quantile intervals, prediction intervals, and how a stakeholder’s desired half-width can determine the number of replications.
Key takeaways
- Observations within one simulation run are often dependent, so a 30-day inventory simulation may yield one independent statistic, such as the fraction of days out of stock, rather than 30 independent samples.
- Transient bias cannot be fixed by adding replications: if every run includes the same startup bias, even 1,000 runs can remain systematically wrong.
- A 95% confidence interval for a mean uses a two-sided t critical value and the replication-level standard error; more independent replications narrow the interval.
- For an 80th-percentile estimate from 1,000 sorted replication outputs, the point estimate is near rank 800, while a 95% interval can be expressed through lower and upper ranks such as 775 and 825.
- A prediction interval estimates the range for a future replication and retains distributional spread as replication count grows, unlike a confidence interval for the mean, which contracts toward zero width.
- A requested maximum half-width provides a practical rule for replication planning: use the confidence-interval formula to determine whether more simulation runs are needed.
Chapters
- Labs 9 and 10 are available; Lab 9 supports either Arena’s Output Analyzer or the course analyzer for histograms and data processing.
- Lab 10 covers signals, holds, and batching, and includes 20 bonus points on top of its 30-point base.
- Homework J2 is the final assignment, due the weekend before Thanksgiving, and combines Arena work with performance metrics.
- A t-test is parametric because it tests a distribution parameter, such as the mean, while relying on assumptions about the data distribution.
- For a small, non-normal one-sample problem, a sign test or signed-rank test can replace a one-sample t-test; Mann-Whitney U is an alternative to a two-sample t-test.
- The test-selection decision tree depends on group count, sample size, independence or pairing, and distribution assumptions; chi-square procedures also require expected bin counts of at least five.
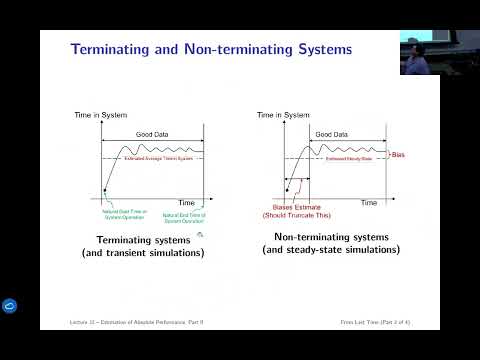
- A terminating system has a meaningful real-world end time, so its initial transient is part of the performance being studied.
- A continuously operating system, such as a 24-hour Walmart or fast-food drive-through, is typically analyzed in steady state rather than during startup.
- Arena can run for a set duration, such as 40 hours, while discarding an initial warm-up period, such as the first 3 hours, to reduce transient bias.
- Daily inventory observations within one 30-day run are dependent, so days 1, 2, and 3 cannot be counted as independent replications.
- A replication can produce one statistic, such as the fraction of days out of stock or the maximum queue length, even when it contains many observations.
- Continuous-time queue length can be summarized by integrating an indicator for queue length above 10 and dividing by the simulated duration to estimate the fraction of time above the threshold.
- The distribution of estimates across replications should be centered on the true performance parameter; a systematic shift is bias.
- Including startup transients in every replication can leave an estimate biased even after 1,000 replications.
- Discarding warm-up data can reduce bias, but the simulation still pays the computational cost of reaching steady state.
- A quantile p is the 100p-th percentile; for example, the median is the 0.50 quantile and the 85th percentile is the 0.85 quantile.
- To estimate a quantile from independent replication outputs, sort the r values and select the rank at or near the ceiling of p times r.
- Traffic engineers often use 85th-percentile driving speed rather than mean speed to assess speed limits and evaluate interventions such as roundabouts.
- A museum evacuation simulation can estimate the 95th-percentile exit time under a fire-alarm explanation and compare a suspect’s observed time with that null distribution.
- A mean confidence interval is the point estimate plus or minus a half-width, representing parameter values that a corresponding two-sided test would not reject.
- For r independent replication estimates, the half-width is the critical t value times the estimated standard error, with r minus 1 degrees of freedom.
- A 95% two-sided confidence interval uses a total type I error rate of 0.05, split into 0.025 in each tail.
- Increasing the number of replications reduces the standard error and narrows the confidence interval.
- The demonstration draws 20 observations from a known normal population with mean 5, forms a 95% confidence interval, and checks whether it contains the true mean.
- Across 100 repeated experiments, four intervals miss the true mean, close to the expected 5% miss rate.
- Ted Pavlic asks students to report interval estimates in lab reports and the final project because a single simulated mean does not show its uncertainty.
- Plots may show standard errors, standard deviations, or confidence intervals, so the caption must identify what each error bar represents.
- With enough samples, a 95% mean confidence half-width is approximately 1.96 standard errors, often rounded to about two standard errors.
- For two groups, nonoverlapping confidence intervals support a significant difference at the interval’s corresponding error level; overlapping intervals do not establish equality and require a formal test.
- Given lower and upper confidence limits, the estimated mean is their midpoint and the half-width is half their difference.
- With the confidence level, replication count, and half-width, the standard error and an estimate of the replication-output standard deviation can be recovered.
- Under the normality assumption, an estimated mean and standard deviation can be used to estimate other quantities, including a normal-distribution percentile.
- Lab 9 practices converting Arena’s reported 95% confidence intervals to 90% intervals using the Kelton textbook’s procedures.
- A quantile interval uses lower and upper ranks in the sorted replication outputs, calculated from the target quantile, a normal critical value, and the replication count.
- For an 80th-percentile estimate from 1,000 observations, the point estimate is the 800th sorted value.
- The example’s 95% interval spans approximately the 775th through 825th ranks, reflecting uncertainty in the estimated 80th percentile.
- A proportion interval uses a related formula; its width accounts for the proportion’s variability and is smaller near 0% or 100%.
- When two groups’ 90% confidence intervals do not overlap, the lecture’s two-group comparison implies a two-sample t-test p-value below 0.10.
- The threshold is 0.10 because a 90% confidence level corresponds to a 10% type I error rate.
- Arena reports means and half-widths, so the half-widths can be used to form and compare confidence intervals rather than ignored.
- A confidence interval estimates uncertainty about a population mean, while a prediction interval estimates where a future replication’s result may fall.
- For normal data, the prediction interval uses a factor involving 1 plus 1/r, so its width does not shrink to zero as the number of replications grows.
- After 20 replications, a 95% prediction interval aims to cover the result of a 21st replication about 95% of the time.
- With many replications, the prediction interval approaches the middle 95% of the output distribution, making it a measure of risk rather than mean-estimation error.
- A stakeholder can specify a maximum acceptable confidence-interval half-width, such as 3 units.
- After an initial set of replications, the half-width formula can be rearranged to estimate how many additional replications are needed.
- For sufficiently large r, replacing the critical t value with a critical z value simplifies the calculation; Lab 9 includes practice with this approach.
Transcript excerpt
0:04 Okay. [clears throat] So, uh, standard announcements. Uh, labs nine and 10 are out. Um, thanks for getting those input modeling reports in. I'll I'll be working on getting you that feedback as soon as possible. Um, otherwise, the next deliverables are the final week of classes. So the Wednesday and final week classes and then your peer reviews the Saturday after that. So um after that feedback is back to you then you're sort of of course if you have questions then you should feel free to talk to me or talk to the TAs. Um but um but that's the last project deliverable until the final ones. So that's uh the idea there. Lab nine is this week. The output analyzer you can use Arena's output analyzer uh or you can use uh this course output analyzer.
0:54 Um there's some it can be a little clunky getting some of the data out of arena. Uh so I tried to streamline it here. This should take the same inputs as the um the arena output analyzer but it'll generate its own histograms. You can uh download data from it. Uh but you don't but it also can do all the data processing inside. Um otherwise lab 10. Um, we've got some topics like signals and holds and batching that that I think individually could be valuable to different projects. Um, so it's remember this is almost like a double lab. It's got it's you know labs are out of 30 and it's got 20 points of bonus credit. So it's one of these things that on top of the drop policy if you were to complete all of lab 10, it's like getting another
1:42 almost a free lab out of it. Uh, but of course the drop policy also applies to
This is the start of the transcript. Save this video free for the whole transcript, searchable and time-coded.
In this course
Related notes
Summary, takeaways, and chapters were generated by AI from the video's transcript and may contain errors. The video belongs to its creator, Ted Pavlic.