Data Mining | L15 : MatSketch
 Watch on YouTube →
Overview
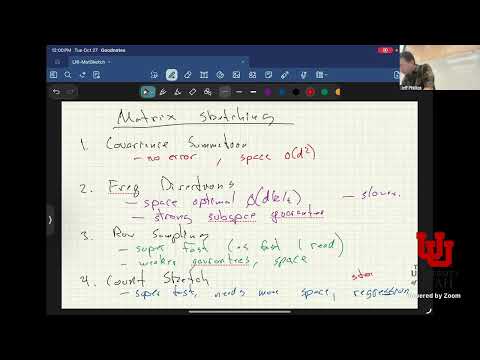
Matrix sketching reduces the cost of PCA and related tasks by streaming rows of a large matrix into a smaller representation that preserves important structure. The lecture compares four methods: exact covariance summation, Frequent Directions, weighted row sampling, and CountSketch, explaining their storage, speed, and approximation trade-offs, including when CountSketch supports regression.
Key takeaways
- The top K right singular vectors of a centered data matrix define its best rank-K feature-space projection, and they can also be recovered as the leading eigenvectors of AᵀA.
- When D is small, streaming the outer products aᵢᵀaᵢ computes AᵀA exactly with O(D²) memory and O(ND²) time.
- Frequent Directions stores an L-by-D buffer and shrinks singular values in orthogonal directions; with L approximately K + K/ε, it provides a relative Frobenius projection-error guarantee.
- Sampling rows proportional to ‖aᵢ‖² is simple and efficient, especially for sparse matrices, but leverage-score sampling gives a stronger relative error bound when the scores are available.
- CountSketch uses hash buckets and random signs to create a compact, mergeable representation whose all-direction guarantee can support regression even when the optimal parameter vector is not known beforehand.
- The practical choice depends on data shape and downstream work: covariance summation suits small D, Frequent Directions favors compact PCA sketches, row sampling favors speed, and CountSketch provides stronger guarantees for regression.
Chapters
- The lecture places matrix sketching in the course’s dimensionality reduction section, alongside upcoming metric learning, random projections, and feature selection.
- Matrix sketching targets datasets too large for a practical full singular value decomposition.
- The course project intermediate report and streaming homework are upcoming deadlines, with peer feedback planned for a later class.
- For an N-by-D data matrix A, the singular value decomposition is A = UΣVᵀ; the right singular vectors in V describe directions in the D-dimensional feature space.
- After centering the data, squared singular values reflect variance along their corresponding directions, up to normalization.
- The top K right singular vectors define the best rank-K projection, with each row represented by its coordinates along those directions.
- For a square positive semidefinite matrix M, eigenpairs satisfy Mv = λv, with real, nonnegative eigenvalues and unit-length eigenvectors.
- Eigenvalues are considered in descending order, λ₁ ≥ λ₂ ≥ … ≥ λD; zero eigenvalues indicate that M is rank deficient.
- The lecture focuses on matrices built from data, such as AᵀA, which are positive semidefinite by construction.
- Setting M = AᵀA makes the right singular vectors of A the eigenvectors of M.
- The eigenvalues of AᵀA are the squared singular values, σⱼ², so an eigendecomposition can recover the same directions used for PCA.
- Using AAᵀ instead relates the left singular vectors to eigenvectors, but the lecture prioritizes AᵀA because it operates in feature space.
- For N greater than D, a full SVD takes on the order of ND² time, which becomes costly when both dimensions are large.
- Standard numerical libraries seek high precision, around 14 digits for double precision, while noisy data analysis often needs only two or three meaningful digits.
- The goal is to stream rows of A into a smaller L-by-D matrix B, with L less than N, while preserving the leading singular values and right singular vectors.
- Covariance summation accumulates M = AᵀA as the sum of row outer products, aᵢᵀaᵢ, without storing the full N-by-D matrix.
- The algorithm initializes a D-by-D zero matrix C and adds each incoming row’s outer product to C.
- It uses O(D²) storage and O(ND²) time; when D is about 100, it can process extremely large N and still produce an exact covariance matrix.
- Frequent Directions targets cases where both N and D are large, such as N = 100 million and D = 100,000, while seeking a much smaller rank K.
- It stores an L-by-D matrix B and inserts each incoming row into an empty row, maintaining at least one empty row between shrink steps.
- When the buffer fills, the algorithm compresses its contents rather than retaining all previously observed rows.
- A shrink step computes the SVD of the small buffer B and sets singular values with index at least L/2 to zero.
- For the retained singular values, it subtracts σₗ₍ₗ/₂₎² from each σⱼ² and takes the square root.
- Shrinking L/2 directions at once amortizes the SVD cost and uses orthogonality to control the approximation error.
- With L approximately K/ε + K, the projection found from B has squared Frobenius error at most (1 + ε) times the best rank-K projection error for A.
- For ε = 0.1, the lecture gives L = 10K as an example; a rank-2 projection would use about 20 buffer rows for that stated guarantee.
- Frequent Directions is compact and has a strong subspace approximation guarantee, but its periodic SVDs make it slower than simpler sketching methods.
- Row sampling builds B by selecting L rows from A, using weighted sampling without replacement rather than treating every row as equally important.
- A simple weight for row aᵢ is its squared norm, ‖aᵢ‖², which favors rows with larger magnitude.
- For sparse matrices, computing row norms and sampling can scale with the number of nonzero entries, making the method close to the cost of one data pass.
- With roughly L = K/ε² samples, squared-norm sampling gives an additive error term proportional to ε‖A‖F² in addition to the best rank-K residual.
- Leverage-score sampling weights rows by their contribution to the top-K left singular subspace, using the squared norm of row i of Uₖ.
- Leverage scores provide a stronger relative bound, at most (1 + ε) times the best rank-K residual, but exact scores require an SVD and are difficult to obtain in a stream.
- CountSketch maps each of the N input rows into one of L sketch rows using hash functions, then adds the row with a randomly chosen positive or negative sign.
- The sketch matrix B starts as zeros; collisions combine rows in the same bucket, while random signs reduce systematic interference.
- Multiple hash sketches can be combined using averaging or a median, with the number of repetitions chosen to control failure probability.
- Random signs keep the sketch centered in expectation while retaining information about the data’s variance and directions.
- The lecture gives a sketch size on the order of D²/ε² for an all-direction guarantee, independent of N, with approximation controlled for every vector x in Rᴰ.
- That stronger guarantee is useful when the parameter vector is unknown in advance, as in regression.
- Regression seeks parameters x that predict row-associated labels through dot products such as aᵢ · x.
- CountSketch can compress a very large A before running a more expensive regression procedure, while preserving the relevant predictions closely.
- The all-direction guarantee matters because the regression algorithm must find x rather than relying on a direction chosen before sketching.
- Covariance summation gives an exact result with O(D²) storage when D is manageable; Frequent Directions offers compact storage and strong rank-K guarantees.
- Weighted row sampling is especially fast for sparse data but has weaker guarantees, while CountSketch uses more space to support all-direction approximation and regression.
- If a full SVD is affordable, it remains the straightforward baseline; sketches become useful when data scale makes that computation impractical.
Transcript excerpt
0:20 Uh great. So let's get started. Um so welcome back everyone. Today we'll be continuing on the section on dimensionality reduction talking about matrix sketching which is how to think about these things at very large scales. Um so just just want to peek at the schedule again. Um where are we? The the streaming homework is due today. Um so um so hopefully you've mostly finished that. If not, there's kind of um um so one more TA hour. Uh so after class, uh the the intermediate report will be due next
1:09 week and hopefully people have been um so signing up for times. Um I was uh so we're a little constrained the time because my schedule's really bad and then the TA who I had had assigned to help me with all this. He's at an academic conference the week we're supposed to be doing the meetings. If you can't find a good time for your group, send me email. We'll try and work something out. But we've I've tried to give a diversity of times, but if nothing works out, please let me know. And also CCTA FAD and so we'll try and find a solution. Um, okay. Um we're in the dimensional reduction
1:57 section. Again, we're doing matrix sketching today. Um will the um I want to point out a couple of the other lectures which are coming up. The metric learning lecture is something where you are we're not so far everything else we're gonna we like using ukitian distance for the most part. um it's it's easy and nice to work with. But sometimes you don't know how to measure the similarity or disting between your data. This will be dimensional reduction while also trying to understand how to measure the distance between your data
This is the start of the transcript. Save this video free for the whole transcript, searchable and time-coded.
Related notes
Summary, takeaways, and chapters were generated by AI from the video's transcript and may contain errors. The video belongs to its creator, UofU Data Science.