Calculus 1000-First Derivative Test-(Section 007, November 9 Fall 2026)
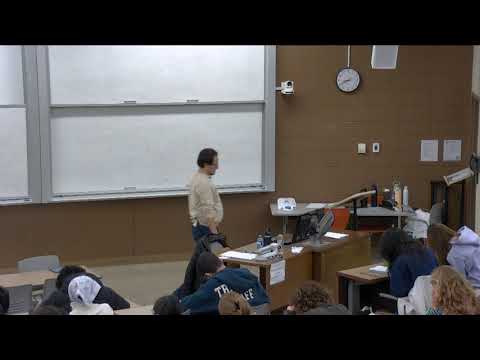
Overview
Asghar Ghorbanpour develops the first derivative test from the increasing/decreasing test: positive and negative derivative signs describe function behavior, and sign changes at continuous critical points identify local maxima and minima. Examples include a cubic, a rational function with critical points at -1, 0, and 1, and an exponential-polynomial function; the lecture ends by introducing concavity and the upcoming use of the second derivative.
Key takeaways
- A critical point is a candidate for a local extremum when the derivative is zero or the function is not differentiable there, but additional analysis is needed to classify it.
- On an interval where f′ is positive, f increases; where f′ is negative, f decreases.
- The first derivative test classifies a continuous critical point by the derivative’s sign change: positive to negative gives a local maximum, and negative to positive gives a local minimum.
- If f′ does not change sign across a critical point, as at x = 0 in the derivative-graph example, that point is not a local maximum or minimum.
- For g(x) = x²/(x⁴ + 1), the critical points -1 and 1 are local maxima with value 1/2, while 0 is a local minimum with value 0.
- Concavity describes how slope changes: tangent lines sit below a concave-up graph and above a concave-down graph.
Chapters
- Asghar Ghorbanpour recalls that local maximum and minimum candidates occur at critical points.
- A critical point occurs where the function is not differentiable or where its derivative equals zero.
- The key task is to classify each candidate as a local maximum, a local minimum, or neither.
- The increasing/decreasing test says f is increasing on an interval where f′ is positive and decreasing where f′ is negative.
- In the previously discussed example, the derivative has zeros at -1, 0, and 1, with signs negative, positive, negative, positive.
- That sign pattern gives increasing intervals (-∞, -1) and (0, 1), and decreasing intervals (-1, 0) and (1, ∞).
- Differentiating gives f′(x) = 6x² - 6x - 12 = 6(x + 1)(x - 2).
- The derivative changes sign at -1 and 2, producing increasing intervals (-∞, -1) and (2, ∞), and a decreasing interval (-1, 2).
- Increasing and decreasing behavior is conventionally reported on open intervals, leaving endpoint behavior aside.
- The product and chain rules give h′(x) = e^(x² - 3x)(2x² - 3x + 1).
- Since the exponential factor is always positive, the derivative sign is determined by 2x² - 3x + 1.
- The polynomial has roots 1/2 and 1, so h increases on (-∞, 1/2) and (1, ∞), and decreases on (1/2, 1).
- The test considers a critical point c where f is continuous and differentiable around c, though it may fail to be differentiable at c itself.
- If f′ changes from positive to negative at c, f rises and then falls, giving a local maximum.
- If f′ changes from negative to positive, f falls and then rises, giving a local minimum.
- If f′ has the same sign on both sides of c, the point is neither a local maximum nor a local minimum.
- For the cubic, the first derivative test gives a local maximum at x = -1 with value 12 and a local minimum at x = 2 with value -15.
- For g(x) = x²/(x⁴ + 1), the derivative is (-2x⁵ + 2x)/(x⁴ + 1)², with critical points -1, 0, and 1.
- The rational function has local maxima at x = -1 and x = 1, each with value 1/2, and a local minimum at x = 0 with value 0.
- When f is differentiable, its critical points can be found from the x-intercepts of the supplied graph of f′.
- The graph identifies critical points at x = -2, -1, 0, 1, and 2; the derivative’s sign on each side determines the classification.
- The sign changes indicate local maxima at -2 and 1, local minima at -1 and 2, and no local extremum at 0 because f′ stays positive.
- Ghorbanpour contrasts increasing curves that bend in different ways, showing that increasing or decreasing behavior alone does not describe a graph’s shape.
- The changing slope distinguishes the shapes: a slope that grows is associated with concave upward behavior, while a slope that shrinks is associated with concave downward behavior.
- The lecture previews using the second derivative to analyze concavity and support further graph analysis.
- For a concave-up curve, tangent lines lie below the graph; for a concave-down curve, tangent lines lie above it.
- These tangent-line relationships provide a visual way to distinguish concave upward from concave downward behavior.
- The second derivative will be used in the next lesson to identify concavity and extend the analysis of local extrema.
Transcript excerpt
0:01 Okay. Hello everyone. Welcome back to calculus 1000. Um today we will continue with the first derivative um and in particular first derivative test. I'm trying to get this mic a little bit less loud. And uh we will do examples and and wrap up the story that we started. This was about local max men. Uh and what we learned was that the key point after understanding the definition uh of
0:50 local maximum we learned about a theorem which was an interesting one says that um this was FMA's theorem which says that uh the candidates I'm writing in my own wording the candidates for the the the local max local mean points are critical points. So the the critical points points are the candidates for local
1:38 max. So in other words we are we are when somebody gives you a function the first thing we should do we should go find critical points and what were critical points [clears throat] we had two types of critical points one f is not differentiable at that point or f is differentiable and it derivative is equal to zero. So these were this was our main thing. But the question that we want to try to figure out is that well which one of critical proofs are going to give us
2:28 actual local max. These are candidates. It means that some of them will be some of them won't. And in particular even even they even even if they are local max mean is it the point that at which the function gets local max or local min. So that those are the questions we wanted to to follow but we started one thing that I will uh go from there. So this is like increasing decreasing test which says that well for the for the
This is the start of the transcript. Save this video free for the whole transcript, searchable and time-coded.
In this course
Related notes
Summary, takeaways, and chapters were generated by AI from the video's transcript and may contain errors. The video belongs to its creator, Asghar Ghorbanpour.