Cálculo de Tamanho de Amostra - G*Power
Overview
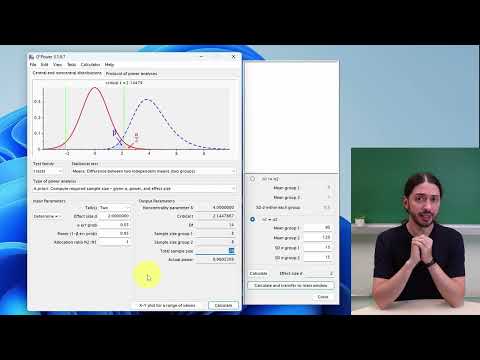
Bruno Martynhak demonstrates how to use G*Power for a priori sample-size calculations, emphasizing that alpha, statistical power, group allocation, and an evidence-based effect size must be set before an experiment. For an independent-groups t test with alpha 0.05, power 0.95, and an expected Cohen's d of 1, the example requires 54 observations total, or 27 per group; a three-group one-way ANOVA with a medium effect can require 252 total.
Key takeaways
- G*Power's a priori sample-size calculation depends on alpha, power, effect size, and allocation ratio; the worked t-test uses 0.05, 0.95, and equal allocation.
- With control glycemia of 90, experimental glycemia of 120, and standard deviation 30, the example yields an effect size of 1 and requires 54 total observations, or 27 per group.
- Reducing outcome variability increases standardized effect size and can lower the sample size needed to detect a fixed difference between groups.
- Effect-size benchmarks of 0.20, 0.50, and 0.80 are conventional classifications, so researchers must justify their chosen effect using prior data and biological context.
- The three-group ANOVA example returns 252 total observations for a medium effect, illustrating how a seemingly modest effect can demand a large sample.
- Setting the sample size to match available funding after the calculation can leave an experiment unable to answer its research question; Martynhak recommends defining assumptions a priori and following the resulting estimate.
Chapters
- Choose the t-test family, an independent-groups comparison, and an a priori calculation in G*Power.
- Set alpha to 0.05, power to 0.95, and allocation ratio to 1 for equal-sized groups.
- Martynhak considers 80% power a commonly accepted minimum, but argues that its 20% false-negative risk is too high for his preference.
- An example compares control-group glycemia of 90 with experimental-group glycemia of 120, using a standard deviation of 30.
- The example produces an effect size of 1; G*Power's conventional reference points are 0.20 small, 0.50 medium, and 0.80 large.
- The calculation requires 54 observations total, interpreted as 27 animals in each group when allocation is equal.
- Lower dispersion increases the standardized effect size and can reduce the sample needed to detect the difference.
- For a one-way ANOVA with three groups and a medium effect, the example yields 252 total observations, approximately 84 per group with equal allocation.
- Martynhak says effect-size assumptions should come from prior data, laboratory variability, or published literature, and should reflect biological relevance.
- He cautions against changing assumptions just to fit a budget, such as choosing eight animals per group when the planned effect requires more.
- A small effect may be worth detecting when no treatment exists, while comparison with an established standard of care should consider the effect's practical value and toxicity.
Transcript excerpt
0:00 agora a gente vai ver como usar o software G Power abrimos ele aqui encontramos essa tela a gente tem aqui a família de testes a gente vai em focar nos testes t e no testes F teste comparação entre dois grupos testes F focando principalmente a novas quando a gente compara mais de dois grupos Vou molhar aqui no teste t a gente vai escolher comparação entre dois grupos Independentes a gente vai calcular a priori Então a gente vai computar qual é a o tamanho de amostra Considerando o alfa o poder e o tamanho de efeito normalmente os testes são
0:50 feitos de maneira a gente já vai voltar nele o alfa fixo em 5% 0,05 o poder eu deixo em 95% 0.95 porque 80% foi um valor completamente arbitrário e ele dá uma chance de falso negativo de 20%, o que para mim é muito alto tudo bem mas você poderia colocar 80% esse seria considerado o mínimo possível aceito alocação entre os tamanhos amostrais eu deixei um porque eu espero ter um n igual entre os dois grupos se dá 10 por grupo eu quero que seja 10 por
1:40 grupo e não 8:12 por exemplo agora como que a gente vai chegar nesse dia aqui existe uma fórmula de calcular para calcular ele manualmente Mas a gente pode determinar aqui então Digamos que os nossos NS sejam iguais entre os grupos e a gente quer ver um efeito por exemplo de glicemia 90 no controle e eu quero ver apenas um leve aumento de glicemia 120 num grupo experimental com um desvio padrão de 30 talvez é claro né esse desvio Talvez para um grupo controle esteja um pouco alto
2:28 coloquei esses valores arbitrários aqui peço para calcular isso dá um tamanho de efeito 1 na hora que eu clico aqui
This is the start of the transcript. Save this video free for the whole transcript, searchable and time-coded.
Related notes
Summary, takeaways, and chapters were generated by AI from the video's transcript and may contain errors. The video belongs to its creator, Bruno Martynhak.