STAT 638 (Fall 2026), Lecture 37
Overview
STAT 638 Lecture 37 presents three Bayesian project analyses: Kyren Liu, Tyler Lowry, and Madhav Thamaran estimate that gamma interferon reduces serious infection rates in chronic granulomatous disease by 61%; Ryan McGahey, Eduardo Macchi, and Tyler Steffy compare Bayesian interim stopping with a classical sample-size approach; and Kai Liu models U.S. market regimes with a hidden Markov model. The projects use Stan's NUTS, beta-binomial simulation, and Gibbs sampling, while discussion from Samiran Sinha highlights model interpretation, fair sequential-design comparisons, and the need for posterior predictive checks.
Key takeaways
- For the CGD recurrent-event analysis, gamma interferon had an estimated rate ratio of 0.39, with a 95% credible interval of 0.21 to 0.70 and a 99.9% posterior probability of reducing serious infections.
- Patient frailty was central to reproducing recurrent infections: the model captured a patient with seven events, while a no-frailty model almost never simulated such a count.
- The Project 13 Bayesian design checked superiority every 25 patients using a posterior probability threshold of 0.8, but its claimed sample-size advantage over the classical method needs a fairer comparison against a classical sequential design.
- In Kai Liu's Gaussian hidden Markov model, turbulent states had 97.31% estimated one-day persistence and lasted about 38.5 trading days on average.
- A Student-t return model materially changed market-risk estimates, lowering the turbulent-to-stable tail-risk ratio from above 5,000 to about 60 by allowing extreme losses in stable periods.
- R-hat, effective sample size, and trace plots evaluate MCMC behavior, not model adequacy; Sinha specifically calls for posterior predictive checks against observed market returns.
Chapters
- Kyren Liu introduces a study of whether gamma interferon reduces serious infections in patients with chronic granulomatous disease.
- The public CGD dataset contains 128 patients across 13 centers, randomly assigned to interferon or placebo.
- The groups experienced 20 infections among 63 interferon patients and 56 among 65 placebo patients, with similar follow-up of about 51 patient-years per group.
- Tyler Lowry describes a Poisson rate model that accounts for unequal follow-up time, treatment, baseline covariates, and patient-specific frailty.
- The weakly informative priors allowed the observed total of 76 infections while also permitting larger counts in prior simulations.
- The team ran four Stan NUTS chains with 3,000 iterations each, discarded 1,500 warm-up iterations per chain, and retained 6,000 draws.
- Convergence checks were strong: maximum R-hat was 1.004, effective sample size exceeded 1,800, and there were no divergences or tree-depth-limit hits.
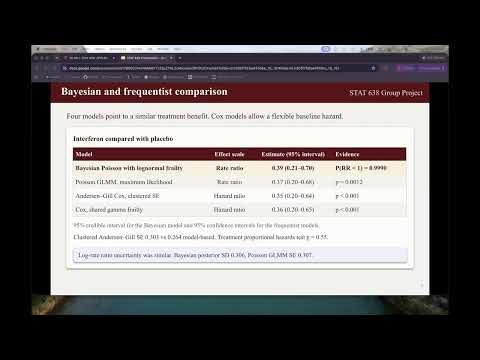
- The estimated interferon-to-placebo infection rate ratio was 0.39, with a 95% credible interval of 0.21 to 0.70.
- The posterior probability of any reduction was 99.9%, and the probability of at least halving the infection rate was about 80%.
- Estimated rates were 107 infections per 100 patient-years with placebo and 42 with interferon, a median reduction of about 65.
- Frailty standard deviation was 0.79, implying that otherwise comparable patients could differ in susceptibility by a typical multiplier of about two.
- Posterior predictive simulations reproduced the observed repeat-infection pattern, including a patient with seven infections, which a model without frailty rarely generated.
- A constant-rate model underpredicted later infections: 37% occurred in the first half of follow-up rather than the expected 50%; allowing a rate change at day 180 did not alter the 0.39 treatment ratio.
- Alternative priors, removing the three highest-count patients, and other model changes left the probability that interferon helps above 99%; frequentist estimates were 0.39, 0.35, and 0.36.
- Adding a count of prior infections suggested a later-rate multiplier of 1.33 without frailty but 1.19 with frailty, indicating the small dataset could not distinguish contagion-like recurrence from persistent susceptibility.
- Samiran Sinha asks why the model needs the patient-level frailty term; Kyren Liu explains that it captures unexplained differences in infection susceptibility after covariate adjustment.
- The group used Stan's NUTS sampler rather than Gibbs sampling, and Sinha probes whether the model's conditional distributions would support direct Gibbs updates.
- Tyler Lowry defends a Poisson likelihood for infection events over split follow-up intervals, while Sinha asks about alternatives such as a Cox model.
- The discussion emphasizes explaining how model terms work and why the chosen likelihood matches the observation process.
- Ryan McGahey, Eduardo Macchi, and Tyler Steffy study a hypothetical two-arm randomized trial with binary response outcomes.
- Independent Jeffreys beta priors are assigned to treatment and control response probabilities, and the criterion is a posterior probability above 0.8 that the treatment benefit exceeds clinical threshold delta.
- The design begins with 25 patients, reassesses after each additional 25, and stops at superiority or a cap of 250 patients.
- At each interim analysis, 10,000 posterior draws estimate superiority probability; the team repeats the process across 5,000 simulated trials per scenario.
- In the example with a 50% treatment response and 30% control response, thresholds of 0, 0.01, and 0.05 reached the criterion at about 50 patients; delta 0.1 needed 75, while 0.15 was not reliably reached by 250.
- Comparing Jeffreys, uniform, and Beta(2,2) priors produced broadly similar patterns, while less frequent interim analyses could enroll extra patients before stopping.
- The classical comparison used a two-sample proportion test with a normal approximation, restricted to settings where expected successes and failures were adequate.
- For the 50% versus 30% example at delta 0.1, the Bayesian design averaged about 75 patients while the classical design required more than 250.
- The team proposes a dependent prior with treatment probability equal to control probability plus an unknown difference, using an informative Beta(2,1) prior for control and a truncated normal prior for the difference.
- That extension would require Metropolis-Hastings sampling; the presentation reports at least a 32% sample-size reduction for scenarios where Bayesian superiority was reliably concluded.
- Sinha points out that comparing Bayesian sequential stopping with a nonsequential classical design does not isolate the effect of Bayesian inference; a classical sequential analysis is also needed.
- The Q&A reviews beta-binomial conjugacy and Jeffreys priors, and exposes that the team could not name the R package it would use for MCMC in the dependent-prior extension.
- Kai Liu analyzes 2000 to 2025 U.S. stock-market returns, classifying trading days as stable or turbulent and estimating regime duration and risk.
- The model uses two Gaussian return distributions, a hidden Markov transition matrix, independent priors for means and variances, and informative transition and initial-state priors.
- Kai uses Gibbs sampling for 5,000 iterations with 1,000 discarded as burn-in, then checks trace plots, autocorrelation, and effective sample size.
- The inferred turbulent periods align with the dot-com bust, the 2008 financial crisis, and COVID-era market disruption.
- The estimated probability of remaining turbulent the next trading day was 97.31%, corresponding to a typical turbulent spell of about 38.5 trading days, with estimates ranging roughly from 25 to 53 days.
- The Gaussian model estimated turbulent periods to be more than 5,000 times as risky for large one-day losses, a result Kai identifies as implausibly extreme.
- Kai reports 86.19% confidence for classifying days at the stated 90%-confidence threshold and estimates a 6.989% chance of a 3% or larger daily loss during turbulent periods.
- Relaxing the strong transition-prior assumptions barely changed results, and frequentist hidden Markov model parameter estimates were broadly similar.
- Replacing Gaussian returns with Student-t distributions and adding a gamma prior for degrees of freedom required Metropolis-Hastings updates alongside Gibbs sampling.
- The Student-t model reduced the turbulent-to-stable tail-risk ratio from above 5,000 to about 60 and increased estimated stable-period risk, reflecting the possibility of extreme losses even in calm markets.
- In the Q&A, Sinha asks Kai to connect the transition matrix to the observation likelihood and notes that the written model did not clearly show how observations depend on transitions.
- Kai had not produced posterior predictive checks; Sinha stresses that MCMC convergence diagnostics assess computation, not whether the fitted model adequately reproduces observed data.
Transcript excerpt
0:01 Sinha, Samiran: Good morning, everyone. So, let's get started. So, project number… Sinha, Samiran: Today, first project will be… Project 14. Sinha, Samiran: So please share your screen, and before you start, I want to tell you one thing, that it will be shared online. So, use of video is completely optional. Sinha, Samiran: Please go ahead. Liu, Kyren: Taylor, can you, like, share the screen? Lowry, Tyler: Yep. Liu, Kyren: For the slides, yeah. Liu, Kyren: And is Madhavior? Lowry, Tyler: Doesn't look like it.
0:46 Liu, Kyren: I didn't see him. Liu, Kyren: Yeah, I can just, like, go ahead. Liu, Kyren: So, tax… Liu, Kyren: To know… Okay. Sinha, Samiran: Please start. Liu, Kyren: So, let's get started. Hi everyone, my name's Kyren Liu, and this is basically our group project number 14, with my teammate of Taylor and Madhav. Liu, Kyren: So, we basically studied, whether the, gamma interferon reduces the serious infections in, patients with, like, chronic, diseases, or, like, the CGD.
1:45 Liu, Kyren: Because, like, the patients can experience, several infections. We use, like, a Bayesian model that accounts for repeated events and, differences in patient susceptibility. Liu, Kyren: And let's go to slide 2. Liu, Kyren: So, here we can see that our data come from the public CGD dataset, and we import it, basically, in our survival package, and it has 128 patients across 13 centers, and they're randomly assigned to interferon or placebo. Liu, Kyren: And there were 20 infections among 63 interferon patients, compared with the 56 among 65 placebo patients. Each group contributed about 51 patient years, so their total follow-up time was quite similar with each other. Liu, Kyren: And a serious infection required hospitalization and injected antibiotics. Among the 44 patients with the infection, we got 17 that had repeated events.
This is the start of the transcript. Save this video free for the whole transcript, searchable and time-coded.
In this course
Related notes
Summary, takeaways, and chapters were generated by AI from the video's transcript and may contain errors. The video belongs to its creator, Samiran Sinha.