Linear Algebra for Engineers lecture 34: Least Squares
Overview
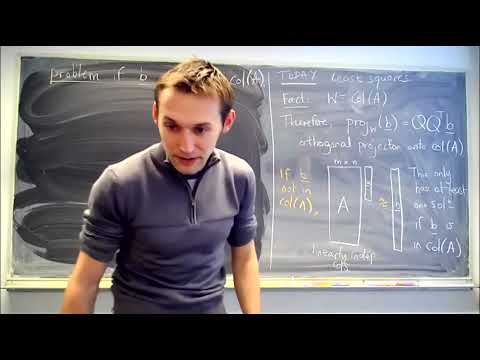
Alex Townsend develops least squares as a way to solve inconsistent systems by projecting the right-hand side onto the matrix's column space, then solving the resulting system efficiently with a QR factorization. He works through a best-fit line for four data points, extends the setup to polynomial models, and illustrates fitting height and weight data from 25,000 Hong Kong students while discussing limitations of the BMI formula.
Key takeaways
- For an inconsistent system A x = b, the least-squares solution minimizes ||b − A x||₂ by projecting b onto the column space of A.
- If A = QR with orthonormal columns in Q, the least-squares coefficients come from the smaller triangular system R x̂ = Qᵀb.
- For the points (0,0), (1,8), (3,8), and (4,20), QR least squares gives the best-fit line y = 1 + 4x.
- A polynomial fit becomes a linear least-squares problem by placing the relevant powers of each input in separate columns of the design matrix.
- Projecting b onto the column space of A provides an exact-solvability check: the system is consistent if the projection equals b.
- Townsend's example with 25,000 Hong Kong student records illustrates how least squares can compare height-weight models, but its fitted curves alone do not establish a clinically reliable BMI replacement.
Chapters
- Gram-Schmidt turns linearly independent columns of A into an orthonormal basis Q.
- The QR factorization writes A = QR, where R is upper triangular and records how A's columns relate to Q.
- Alex Townsend introduces QR as the tool for fitting trend lines to data.
- The column space of A is the span of its columns.
- When Q has orthonormal columns spanning that space, Q Qᵀ b is the orthogonal projection of b onto it.
- The projection is the closest vector in the column space to b.
- A system A x = b has a solution exactly when b lies in the column space of A.
- If b is outside that space, least squares seeks the smallest change to b that makes the system solvable.
- Orthogonal projection gives that closest right-hand side and minimizes the residual length, ||b − A x||₂.
- With A = QR, the projected system is A x̂ = Q Qᵀ b.
- Applying Qᵀ yields R x̂ = Qᵀ b because QᵀQ is the identity.
- The resulting system uses the smaller upper-triangular R rather than solving a large system involving the full projection.
- Townsend fits a line y = c + d x to (0,0), (1,8), (3,8), and (4,20).
- The four data points cannot all lie on one line, so the system for c and d is inconsistent.
- The design matrix has columns [1,1,1,1]ᵀ and [0,1,3,4]ᵀ, with right-hand side [0,8,8,20]ᵀ.
- Gram-Schmidt produces orthonormal columns q₁ = [1,1,1,1]ᵀ/2 and q₂ = [-2,-1,1,2]ᵀ/√10.
- The resulting triangular factor is R = [[2,4],[0,√10]].
- Solving R[c,d]ᵀ = Qᵀb gives c = 1 and d = 4, so the least-squares line is y = 1 + 4x.
- The fitted line y = 1 + 4x misses all four example points but minimizes the sum of squared vertical residuals.
- A quadratic fit uses columns for 1, x, and x²; for x values 0, 1, 3, and 4, those columns are [1,1,1,1]ᵀ, [0,1,3,4]ᵀ, and [0,1,9,16]ᵀ.
- The same QR procedure can fit cubic or higher-degree models by adding columns for further powers of x.
- If b is already in the column space of A, projecting it with Q Qᵀ returns b unchanged.
- A changed projected vector indicates that the original system had no exact solution.
- When projection leaves b unchanged, least squares still works and the residual is zero.
- Townsend describes fitting height and weight measurements from 25,000 Hong Kong students as a large least-squares problem.
- He tests the model weight = C × height², representing the height-squared relationship used in the BMI formula.
- In Julia and MATLAB, the backslash operator can solve the least-squares problem; the example's design matrix has 25,000 rows.
- Townsend compares the height-squared model with a cubic model using columns for 1, height, height², and height³.
- The cubic fit reduces the residual error somewhat, while the plotted data cloud suggests that a simple curve may not capture every pattern.
- He proposes that height-based BMI estimates may systematically differ for very short and very tall people, while presenting the analysis as a data-driven critique rather than a clinical validation.
Transcript excerpt
0:00 squares. It's um how you fit uh trend lines to data. So you do le squares, you do grammid and then uh look at it in a particular way and it gives you trend lines. Uh so I'll show you how that all works. Okay. So okay, the joining assignment is lecture 34. This is not on the final unfortunately very sad uh section 6.5 of the textbook. Okay. So which is also not on the final right. Okay. So uh this is our well one big application of um Graham Schmidt and QR. Okay. So uh give me a ve give me a vector space. Give me a basis for that vector space. We know that we can turn
0:47 that average basis into an orthonormal one by first doing Graham Schmidt. That gives us an orthogonal one and then normalizing those vectors making sure they have length one and that gives us an orthonormal basis. Okay, we we found out last time that we can actually store G elimination a bit like how we store elimination using a factorization. In fact, Graham Schmidt is basically equivalent to factorizing a matrix A an average a matrix with average columns that are linearly independent. Right? These are linearly independent columns factorizing those average columns into a matrix with orthonormal columns.
1:38 that these are orthonormal. These have orthonormal columns still n byn and an upper triangular matrix a square upper triangular matrix. Okay, so that's what we found out last time and now we're going to try to use a= qr to uh make trend lines of data. Is there only one way to compute r? is QRPOSE A or is there is there another way? Um, okay. In class, I didn't actually compute R by doing QRanspose A which you could do that way. There's a far the way
This is the start of the transcript. Save this video free for the whole transcript, searchable and time-coded.
In this course
Related notes
Summary, takeaways, and chapters were generated by AI from the video's transcript and may contain errors. The video belongs to its creator, Alex Townsend.