Lecture 7f
 Watch on YouTube →
Overview
Prof. Schniter uses MNIST handwritten-digit classification to demonstrate a three-layer multilayer perceptron and practical deep-network training choices. The example trains on 60,000 of MNIST’s 70,000 grayscale 28×28 images, reaching about 98.8% test accuracy with two 500-unit hidden layers, batch normalization, GELU, dropout, cross-entropy, and AdamW; the lecture also explains data reshaping and the tradeoffs between manual hyperparameter tuning and Optuna.
Key takeaways
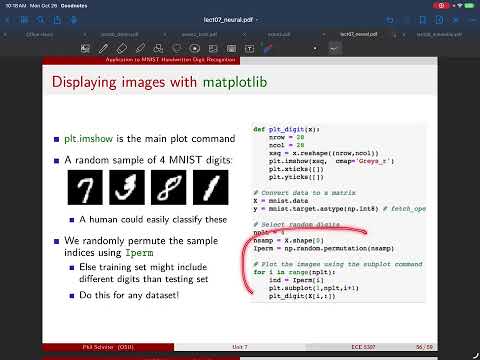
- MNIST’s 70,000 grayscale 28×28 images become 784-feature vectors for an MLP, but the reshape order matters: NumPy uses row-major ordering, unlike the column-stacking convention often used in MATLAB and mathematical writing.
- A two-hidden-layer MLP with 500 units per layer, batch normalization, GELU, dropout p=0.2, and AdamW achieved about 98.8% test accuracy after 20 epochs on a 60,000/10,000 train-test split.
- Permuting MNIST samples is important because examples are organized in digit groups; leaving the data ordered can undermine random sampling and training procedures.
- Batch size and learning rate should be tuned together because their optimal values depend on one another.
- Optuna can automate adaptive hyperparameter search, but useful results may require extensive computation, and automated selection alone does not explain why a configuration works.
- The lecture distinguishes generic MLPs, which alternate matrix multiplications and elementwise nonlinearities, from transformer layers, while noting that ensembles can combine several neural networks.
Chapters
- MNIST contains 70,000 grayscale images, each 28×28 pixels, with labels from 0 through 9 and 784 features per flattened image.
- The dataset was collected by the U.S. Census Bureau in the 1980s, with automated ZIP-code recognition as a motivating application.
- Raw pixel values are integers from 0 to 255; NumPy ravel, flatten, or reshape can convert each image to a 784-element vector and back.
- NumPy reshapes in row-major order, while papers and MATLAB often use column stacking; the samples should also be permuted because they are grouped by digit.
- The course demo uses two hidden layers with 500 units each, batch normalization after linear layers, GELU activations, and dropout with p=0.2.
- Training uses cross-entropy loss, the AdamW optimizer, an exponentially decreasing learning rate, 60,000 training samples, and 10,000 test samples over 20 epochs.
- Training accuracy approaches 100%, while test accuracy reaches about 98.8%; logistic regression typically has difficulty exceeding 90% on this task.
- The example illustrates increasing network capacity until training performance is near-perfect, then evaluating generalization on held-out data.
- Design choices include layer count and width, activation, optimizer, batch size, learning-rate schedule, epochs, dropout placement and rate, and weight decay.
- Batch size and learning rate interact, so changing one can change the best choice for the other; systematic manual experiments can help explain those tradeoffs.
- Optuna searches specified parameter ranges through repeated trials and adaptive sampling, but competitive tuning can require substantial computation, potentially running for days.
- For projects intended to demonstrate understanding, explaining why architecture and training settings were chosen is more informative than reporting Optuna’s winning configuration alone.
- MLPs alternate matrix multiplications and elementwise nonlinearities; transformer layers provide a different neural-network structure, while ensembles combine multiple models.
Transcript excerpt
0:02 All right. So, we're just going to uh quickly finish up our unit on neural networks. Uh most recently, we talked about deep networks and various tricks for training them. And today we're going to talk about um applying deep networks and those tricks to um emnest handwritten digit recognition. So, first a little bit about the data set. This is a very popular data set for um machine learning classes because it is um small enough that you can work with it on like a laptop but large enough to be um interesting um certainly not not a toy data set like many of the other ones
0:52 that we've u seen so far are. So uh the data set is basically uh these small images of handwritten digits. Those are the features. And then the labels are the um the numerical digit from 0 through 9 that that image represents. Um so for example here you can see a bunch of images of handwritten zeros. Then we have handwritten ones and so on all the way up to handwritten nines. Okay. So each of those images the features are 28 by 28 and they are grayscale images not color
1:41 meaning that the uh the individual pixels in the image are each uh brightness value. So zero being black and the maximum however the data set is scaled to be would be white and then you know anything between zero and the maximum would be gray. So this data set um has 70,000 examples of these images or 70,000 samples. They were collected in the 1980s by the American Census Bureau. One of the motivations I believe was to automatically scale uh scan uh the zip codes in on on letters, you know, mail packages in order to automatically route
This is the start of the transcript. Save this video free for the whole transcript, searchable and time-coded.
Related notes
Summary, takeaways, and chapters were generated by AI from the video's transcript and may contain errors. The video belongs to its creator, Prof. Schniter.