Intro to Statistics at IU Indianapolis - Data Types Lecture
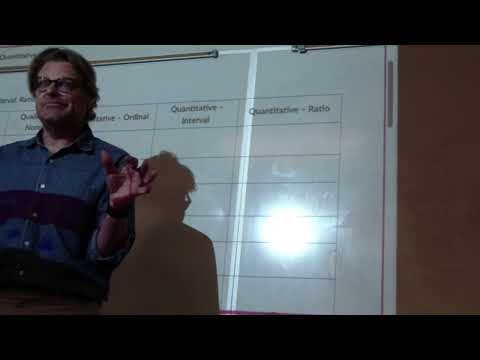
Overview
Andy Baker introduces qualitative and quantitative data, then explains four measurement levels: nominal, ordinal, interval, and ratio. Using examples such as ZIP codes, Fahrenheit temperatures, age, commute time, and IU Indianapolis survey responses, he shows which comparisons and calculations each level supports, then distinguishes discrete from continuous numerical values for coding data in SPSS.
Key takeaways
- A number can be qualitative when it serves only as a label: ZIP codes, phone numbers, and jersey numbers should not be averaged.
- Nominal data have unordered categories, ordinal data add rank, interval data add equal gaps, and ratio data add a meaningful zero.
- A true zero determines whether proportional comparisons make sense: 80°F is not twice as warm as 40°F, but four children is twice as many as two.
- The response format determines the measurement level: work-status categories are ordinal, while reported hours worked are ratio data.
- Discrete counts such as sibling totals cannot take meaningful fractional values, whereas continuous measurements such as temperature can.
- SPSS requires users to identify how numerical variables should be treated, so classifying data correctly is part of preparing it for analysis.
Chapters
- Andy Baker defines statistics as the science of collecting, organizing, analyzing, interpreting, and presenting data.
- The class survey already collected data; this lecture focuses on organizing it.
- Lab 1 applies all five parts of the definition.
- Qualitative data describe, label, or group observations; examples include interview transcripts and social-media comments.
- Quantitative data are numerical values that can be counted or measured, such as likes or the number of comments.
- Qualitative responses can be analyzed by coding comments as positive or negative, then counting those categories.
- Numbers do not automatically make data quantitative: ZIP codes, phone numbers, interstate numbers, and jersey numbers function as labels.
- A jersey number such as 87 cannot meaningfully be averaged with another jersey number.
- Age is quantitative because it measures a quantity, unlike a number used only to identify a category.
- Nominal data are named categories with no meaningful ranking, such as eye color, ZIP code, or political party.
- Nominal categories have no equal numerical gaps or true zero, so calculating a mean or saying one category is twice another is not meaningful.
- Useful summaries include the mode and visual displays such as a pie chart showing category percentages.
- Ordinal data add an order to named categories, as with freshman, sophomore, junior, and senior class standing.
- Ratings, class rank, and letter grades can be ordered, but the gaps between categories are not necessarily equal.
- Ordinal data support finding the mode and median, but a mean is generally not justified; some rating scales are pragmatically treated as interval.
- Interval data have ordered numerical values with equal gaps, illustrated by Fahrenheit temperature and calendar years.
- A difference of four degrees is consistent across the Fahrenheit scale, so interval values can be averaged.
- Fahrenheit zero is not the absence of temperature, so 80°F cannot be described as twice as warm as 40°F.
- Ratio data have equal numerical intervals and a true zero representing the absence of the measured quantity.
- Age, height, income, number of children, and number of siblings are examples; each can have a meaningful zero.
- Ratio data support averages and proportional statements, such as four children being twice as many as two.
- In a think-pair-share activity, students classify nine earlier survey questions as nominal, ordinal, interval, or ratio.
- Gender is nominal, year in school is ordinal, and age is ratio; these classifications depend on what the response represents.
- A work-status question with ordered response categories is ordinal, even though actual hours worked would be ratio data.
- Commute time, sleep hours, and daily minutes on social media are ratio measurements because zero minutes is possible.
- The class survey's average commute was about 20 minutes; average social-media use was about 120 minutes, with 240 minutes as the most common response.
- Confidence categories are ordinal, while a stress-rating scale may be treated as ordinal or, in some analyses, as interval; Baker says ambiguous cases will not be used in quizzes.
- Discrete values are whole-number counts with no meaningful fractions, such as the number of siblings.
- Continuous values can take intermediate values, as Fahrenheit temperature can rise through decimal values between 76° and 78°.
- When entering data in SPSS, users must identify the kind of value because the software cannot infer whether a number is a count or a continuous measurement.
Transcript excerpt
0:00 Okay. Yeah. Oh, now we're great. Now we're great. Perfect. All right. And so I will add the video. Once again, don't take attendance, but of course those uh those Thursdays I will in the fact that we'll have quizzes. All right. Um anything else? Lab one now available. Yep. I just mentioned that. All right. So, let's get lecturing. Maybe turn down some lights here a little bit. What's going to go on here? Yeah, we'll do that. All right. So, I'm going to pull this up and I'm going to use the projector and write on this if you don't mind. Come on, buddy. There you go. All right. So, as this says, we got our
0:48 definition. So, this is, you know, I 3,000 different uh books you could use. Obviously with AI we can get all kinds of definitions and this is pretty much the simplest one. Uh statistics is the science of collecting, organizing, analyzing, interpreting and presenting data. Guess what you're doing in lab one? All of those. So you'll be doing all those. What have we already done in class? We've already collected. Remember that survey I distributed at the very end of last time? That was collecting. Today, what we're going to do is talk about the organizing of that particular data that I passed out at the end of last time. And so, we'll focus in on the organizing, but data. And so, that's the thing that we're going to be focusing on is okay, what is data? And so, we're going to be talking about data in
1:36 different terms. Uh, so these are big words. Uh, so these are big words that, you know, I want you to to to take and use. Uh so you know when we when you
This is the start of the transcript. Save this video free for the whole transcript, searchable and time-coded.
Related notes
Summary, takeaways, and chapters were generated by AI from the video's transcript and may contain errors. The video belongs to its creator, Andy Baker.