EDF9850_Lecture2_Part2
 Watch on YouTube →
Overview
Lesa Hoffman demonstrates how to fit and interpret empty and level-two multilevel models in R, using school math scores from more than 7,000 students in 160 schools. She explains clustering statistics, centering, model comparison under REML, variance explained by school-level predictors, and how interactions change conditional slopes, with practical R guidance using lme4 and nlme.
Key takeaways
- With over 7,000 students in 160 schools, the example estimates ICC1 near 0.18, showing that school clustering is substantial enough to require a multilevel model.
- A design effect near 9 can reduce an apparent sample of about 7,000 students to an effective sample around 805, while the large average cluster size supports school-mean reliability near ICC2 = 0.90.
- Centering school size at 1,000 students makes the fixed intercept interpretable as the predicted math score for a typical-sized school; without centering, the intercept would describe a school with zero students.
- Under REML, log-likelihood comparisons are not valid when fixed effects differ; use fixed-effect tests for added predictors and likelihood-ratio tests for random-effect changes with fixed effects held constant.
- Level-two predictors explain between-school random-intercept variance, not within-school student residual variance, because students in a school share the same school characteristics.
- In an interaction model, the school-size main effect applies only to public schools when public is coded zero, and the interaction coefficient tests whether the private-school slope differs from the public-school slope.
Chapters
- Hoffman provides the Unit 2 R files and explains that the curated example can be followed without running code.
- R sessions do not retain externally developed packages, so packages must be loaded again in each fresh session; Control+Enter runs selected code.
- Set the working directory so R can find input data and save outputs, and source the shared functions file from its separate directory.
- If lme4 reports a matrix-package error, uncomment and run the provided fix; first-time package installation may take longer.
- The example uses math scores for over 7,000 students nested in 160 schools, averaging about 45 students per school.
- Hoffman filters the data to cases complete on all analysis variables so that adding predictors does not silently change the sample across models.
- Missing level-two information such as school type can exclude an entire school cluster, not just one student.
- Full-information maximum likelihood and multiple imputation are possible missing-data approaches, but multivariate methods are beyond this class example.
- School size is rescaled per 100 students and centered at 1,000, making the intercept refer to a plausible school rather than a school with zero students.
- The single-level empty-means model estimates the overall math mean and pools all outcome variance into one residual component.
- The empty model supplies a baseline fit statistic; in practice, a random-intercept model can be fit directly and tested with a likelihood-ratio comparison.
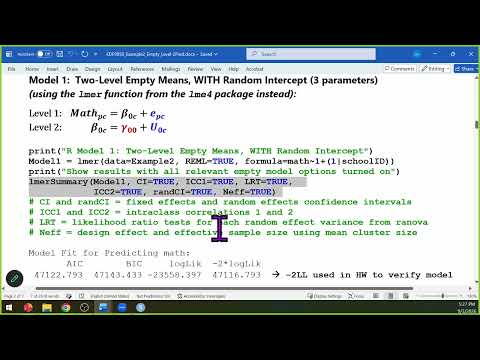
- In R formulas, the tilde separates outcome from predictors, while the one represents a fixed intercept and a parenthesized one requests a random intercept by school ID.
- The random-intercept variance, about 8.6, captures adjusted differences among school means; the student-level residual variance is about 39.
- ICC1 is approximately 0.18, meaning about 18% of math-score variance lies between schools and students in the same school have an expected correlation near 0.18.
- The random-intercept likelihood-ratio statistic is about 986, far above the one-degree-of-freedom reference value of 3.84; the boundary-adjusted mixture p-value is used because variances cannot be negative.
- A fixed-effect confidence interval describes uncertainty in the estimated average school mean, whereas a random-effect interval describes variation in school means around that average.
- The design effect is about 9, reducing an apparent sample of roughly 7,000 students to an effective sample near 805 for some purposes.
- A design effect near 9 implies that a study may need roughly nine times as many sampled students to offset this clustering under the example's design.
- ICC2 reliability is about 0.90 because each school contributes many students; ICC2 depends on ICC1 and cluster size, not directly on the number of schools.
- Using the estimated school-level standard deviation, Hoffman describes the expected range of school means as roughly 6.8 to 18.4 around a mean near 12.
- Subscripts identify whether a quantity varies across students, indexed P, or schools, indexed C, which is essential for distinguishing levels.
- The level-two equation predicts each school's level-one intercept: gamma coefficients are fixed effects, while U0C is a school-specific random-intercept value.
- The level-one residual E varies by student, but the basic model assumes the residual variance is the same across all schools.
- Models that allow residual variance to differ across clusters are called location-scale mixed-effects models, useful for questions such as whether some supervisors produce more disagreement among employees.
- Hoffman uses lme4 for the course's clustered models and introduces nlme as an alternative with similar model specifications.
- The nlme function lme separates fixed and random formulas and uses method="REML" rather than lme4's REML argument.
- Longitudinal analyses may require nlme because it can model residual autocorrelation between occasions that are closer together in time.
- nlme also supports heterogeneous variance components, such as separate variance estimates for monozygotic and dizygotic twins, which lme4 does not provide in the discussed setup.
- School size and public-versus-private status are fixed level-two predictors, so they belong outside the random-effects parentheses.
- The model's school-level predictors explain variance in the random intercept, not student-level residual variance, because all students in a school share those characteristics.
- Under REML, models with different fixed effects cannot be compared using log-likelihood differences because their likelihoods are on different scales.
- Hoffman evaluates added fixed slopes using their coefficient tests, reserving likelihood-ratio comparisons for models with the same fixed effects but different random effects.
- The fixed intercept is the predicted math score for a public school with 1,000 students, the reference values established by centering and coding.
- School size has a small, nonsignificant association with school mean math, while private schools average roughly three points higher than public schools.
- The school-level predictors explain about 23% of the initial between-school variance, not 23% of all math-score variance; the level-one residual variance changes only slightly.
- A total R-squared based on the correlation between observed scores and fixed-effect predictions is about 4%, while multilevel pseudo-R-squared measures variance reduction at a particular level.
- R's asterisk between school size and school type adds both main effects and their two-way interaction; a colon adds only the interaction.
- With public school coded as zero, the school-size coefficient is the conditional slope for public schools; the private-school coefficient is the public-private difference at a school size of 1,000.
- The interaction coefficient describes how the school-size slope changes between private and public schools, rather than a direct effect on math scores.
- The interaction estimate is positive but nonsignificant, so the data do not establish that school-size slopes differ across public and private schools.
- To obtain the school-size slope for private schools, combine the school-size main effect with the school-size-by-private interaction coefficient.
- Hoffman uses a one-dimensional linear-combination function to calculate the conditional slope and its standard error and p-value, rather than adding coefficients by hand.
- The interaction adds only a small amount to pseudo-R-squared and total R-squared, consistent with its nonsignificant test.
- The example's sample results section describes model choices, software and packages, coefficient interpretations, and links findings to research questions; class examples include templates for future reporting.
Transcript excerpt
0:00 I'm going to start a new recording. So, since that's a stopping point. So, let me introduce some new terminology and take a vote here. Example two was started last week in the third hour of class. So, your choices as to uh how we drop back into this is I pretend you have perfect recall and attention for three hours straight. That's what I thought. I pretend that we all have amnesia and you've never seen it before and we start from that or the middle ground of what I call rego over like it's not just a review. It's like like rego over is that one review would be somewhere in the middle. So amnesia rego over is what I saw a lot of people nodding. Zoomers, what do you think?
0:48 Vote few votes for amnesia. Okay, that's what I thought. So, if you would like to run these files along with me, you are welcome to do so. The originals, show you in my file system here, unit 2 is where all this stuff is. And inside unit 2, I'm going to open R for a second so I can show you one or two things. As I said before, I've been in classes and workshops where we had to run things with us like together and if you get off on the first step, then you're you can't continue with the exercise and I find that frustrating. So, I didn't want to have to do that to you. So, I curated an example such that you don't actually
1:36 have to run things. Yes. >> Thank you. >> You're welcome. [laughter] No, this happened to me. I was trying to learn how to use the Palmetto high performance cluster thing and there was this code that we had to like modify and
This is the start of the transcript. Save this video free for the whole transcript, searchable and time-coded.
Related notes
Summary, takeaways, and chapters were generated by AI from the video's transcript and may contain errors. The video belongs to its creator, Lesa Hoffman.