EDF9850_Example3_Part1
 Watch on YouTube →
Overview
Lesa Hoffman demonstrates how to separate student-level and school-level relationships in a two-level model using R, school cluster means, and cluster-mean centering. With math achievement as the outcome, she interprets an empty-model ICC of 0.18, shows that a combined SES correlation of 0.36 conceals within-school and between-school correlations of about 0.23 and 0.79, and estimates distinct within-school and school-level SES effects.
Key takeaways
- Cluster-mean centering separates a student's deviation from their school mean from the school's average, allowing distinct within-school and between-school effects in a multilevel model.
- In Hoffman's example, the math-SCES correlation is about 0.36 when levels are combined, compared with about 0.23 within schools and 0.79 between schools; the combined value obscures substantively different relationships.
- The empty math model's ICC of 0.18 means 18% of math-score variance lies between schools, providing a baseline for evaluating school-level predictors and variance reduction.
- The SCES predictor has an ICC near 0.26, while binary non-white status has a logistic latent-scale ICC near 0.62 using residual variance 3.29; both predictors therefore require attention to school clustering.
- The estimated within-school SCES slope is about 2.2 math points per unit, while the school-mean slope is about 5.8; their estimated difference of roughly 3.6 represents the contextual effect.
- Hoffman notes that an explained student-level predictor can coincide with a small increase in estimated random-intercept variance, producing a negative level-specific pseudo-R-squared without indicating a coding error.
Chapters
- Hoffman plans to review Example 3 on cluster-mean centering, then cover Formative Assessment 3 and an in-class Activity 3 modeled on Homework 1.
- She reassures students that multilevel modeling takes repeated exposure, especially when translating clustered-data concepts to longitudinal research.
- Brian suggests an anonymous, shared Google document organized by lectures and examples, where students can post timestamped questions and help each other asynchronously.
- Hoffman points students to lisahhoffman.com and pilesofvariance.com for course materials, scripts, data, and examples in R, SAS, Stata, SPSS, and Mplus.
- She says students need not learn every package, but comparing implementations can deepen understanding of the statistical model.
- The example predicts student math scores from continuous socioeconomic status, labeled SCES, and a binary indicator for identifying as white or non-white.
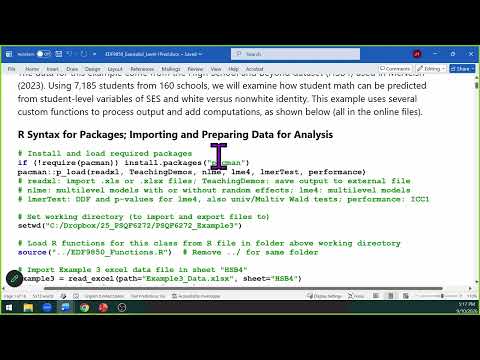
- Hoffman reads an Excel file into R, checks that it is a data frame, and filters to cases complete on all three analysis variables.
- She notes that the data documentation does not explain the SCES scale, so the meaning of a one-unit change remains unclear.
- Hoffman uses a custom add-unit-means function to calculate school-level means for math, SCES, and non-white status using school ID as the cluster variable.
- The function appends each school mean to every student row and also stores the school size in an n-per variable.
- She builds a school-level data set to summarize variation and correlations, using school mean math descriptively rather than as a predictor.
- For each student, Hoffman subtracts the mean of that student's school from the student's SCES and math values, creating within-school variables.
- A positive within-school SCES value means the student has a higher SCES score than peers at the same school; a negative value means lower than peers.
- She distinguishes variable centering from subtracting a constant: cluster-mean centering deliberately removes between-school information from a level-one variable.
- Hoffman centers the school-level proportion of non-white students at about 30%, making the reference school more interpretable than one with zero non-white students.
- Binary predictors can also be cluster-mean centered, producing decimal deviations rather than only zeroes and ones.
- She recommends an article by a student of Kris Preacher for guidance on coding categorical predictors in multilevel models.
- The combined student-level correlation between math and SCES is about 0.36, while the within-school correlation is about 0.23 and the between-school correlation is about 0.78 to 0.79.
- The overall correlation mixes individual and school-context relationships, with its value pulled toward the within-school association because the data contain many more students than schools.
- Hoffman argues that separating the levels matters for interpreting causes and interventions, since individual resources and school structure may require different responses.
- Hoffman starts with an unconditional, or empty, model to establish a baseline and calculate the intraclass correlation coefficient, ICC1.
- In her notation, a student-level residual E represents within-school variation, while a school random intercept U represents between-school variation.
- The fixed intercept is the mean of the school means, and the random intercept records how each school's mean differs from that overall anchor.
- The empty math model estimates an ICC of 0.18: 18% of math-score variance is between schools and 82% is among students within schools.
- The level-one residual variance assumes students are equally variable in math across schools; modeling differences in that variance is outside this example.
- Hoffman explains that a likelihood-ratio test compares the model with a school random intercept to one without it, adding one variance parameter.
- Treating continuous SCES as an outcome yields an ICC of about 0.26, indicating meaningful school-level clustering in socioeconomic status.
- For binary non-white status, Hoffman uses a multilevel logistic model with a logit link and fixed logistic residual variance of 3.29; its latent-scale ICC is about 0.62.
- The substantial ICCs for both predictors mean their within-school and between-school associations with math should not be combined into a single smooshed effect.
- The first predictor model uses cluster-mean-centered SCES, so its coefficient estimates the association between a student's SCES and math relative to school peers.
- The estimated within-school slope is about 2.1: a one-unit SCES advantage over a student's school mean corresponds to roughly 2.1 higher math points.
- This level-one predictor targets student-level residual variance; the model attributes about 5.5% of that variance to relative SCES and reports a total R-squared of about 4.4%.
- Hoffman recommends including both within-school SCES and school mean SCES to answer the overall SCES question while distinguishing the two levels.
- The within-school estimate remains about 2.2, while the school-mean slope is about 5.8 to 5.9 math points per SCES unit between schools.
- The school mean predictor targets between-school variance, and its coefficient describes a school-level association that does not adjust for students' individual SCES.
- Hoffman tests whether the between-school slope exceeds the within-school slope by estimating their difference, approximately 5.8 minus 2.2, or 3.6 points.
- A significant difference is the contextual effect: the incremental association of school context with math after accounting for students' own SCES.
- The coefficients are unstandardized and use different levels of variation, so their raw sizes should not be compared without considering scale and variance.
Transcript excerpt
0:00 All right, let me hit the record button. That way I can officially kick things off. Welcome back. Hello everybody. Happy Thursday to you. I'm going to start the screen share so I don't forget that because that is one of my tendencies to do so. Which of course means my windows all move themselves around in a weird way. Floating me. There we go. All right. So on tap for today then continuing discussion of lecture three which you would have ostensibly finished watching the second half of in preparation for this class. Not sure if we're going to get to all of that right now but we'll see. Um example three the first half of it is about last week's stuff in terms of cluster mean centering and what that does. So we'll certainly get through that. Uh formative assessment number three is about the
0:48 newer stuff and so that will be next. And then activity three. Activity two. We have two activity twos. Hang on. What day is it? Activity should be three. There we go. That's the one I'm looking for. Uh at the end of class. So what it is is a very scaled down version of homework one is. So if you've been procrastinating on that, you can wade yourself in gently, get a little bit of practice and a chance to walk through things with your friends and I will I will look at your responses and get and potentially give out an answer key and or grade them myself. I haven't quite decided how that landed. You're still welcome to work in small groups or by yourself as that. And if you're someone who does not prefer to work during class to do these things, you can eject with no uh judgment from me. Okay. So, how
This is the start of the transcript. Save this video free for the whole transcript, searchable and time-coded.
Related notes
Summary, takeaways, and chapters were generated by AI from the video's transcript and may contain errors. The video belongs to its creator, Lesa Hoffman.