EDF9850_Example3_Part2
 Watch on YouTube →
Overview
Lesa Hoffman compares cluster-mean centering with grand-mean or other constant centering in multilevel models of student socioeconomic status (SES) and math scores. She explains how omitting school-mean SES creates a conflated, or “smooshed,” effect that incorrectly mixes within-school and between-school relationships, and shows how adding the school mean separates these effects; the class then begins an R activity preparing students for homework on level-two predictors.
Key takeaways
- The 68.7% figure describes the share of school-level variance explained by school-mean SES, not 68.7% of total math-score variance; its contribution to total variance is about 16%.
- A student-level predictor that appears to explain school-level intercept variance may contain a hidden school-level component, indicating a conflated or smooshed model.
- Leaving school-mean SES out of a model with grand-mean-centered student SES forces one slope to represent both within-school and between-school relationships, potentially understating the between-school effect.
- Including school-mean SES alongside student SES separates effects: cluster-mean-centered specifications yield a between-school coefficient, while grand-mean-centered specifications yield a contextual coefficient.
- Between-school, within-school, and contextual effects are not independent: between equals within plus contextual, so any one can be derived from the other two.
- For interactions involving a level-one predictor, include the corresponding level-two term when needed to keep within- and between-school effects distinct.
Chapters
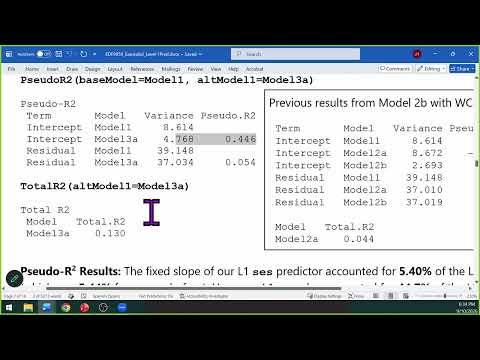
- Adding school-mean SES explains 68.7% of school-level math variance, equivalent to about 16% of total variance; student SES had accounted for 4.4% of total variance.
- Changing the centering constant changes the fixed intercept's meaning, not the underlying type of effect estimated.
- A grand-mean-centered student SES predictor entered without school-mean SES combines within-school and between-school effects into one coefficient.
- Student SES should primarily explain level-one residual variance; a level-one predictor explaining school-level intercept variance signals conflation.
- The uncentered or grand-mean-centered model gives a shared slope of about 2.4, effectively assuming that the within-school and between-school SES effects are equal.
- The correctly specified model explains about 68% of intercept variance, compared with 45% for the smooshed model; the latter underestimates the between-school effect, about 2.4 rather than 5.9.
- Hoffman describes the issue as a conflated effect, also calling it smooshed: school-level differences embedded in student SES act as a hidden school-level predictor.
- Adding school-mean SES to a grand-mean-centered student SES model controls for the level-two component, leaving the student SES coefficient to represent the within-school effect.
- The cluster-mean-centered model estimates a within-school slope of about 2.19; the corrected grand-mean-centered model reaches the same within effect through statistical control.
- With cluster-mean centering, the school-mean coefficient represents the between-school effect; with grand-mean centering plus school mean, it represents the contextual effect beyond individual SES.
- The relationships are linear combinations: between effect equals within plus contextual, and contextual equals between minus within.
- A level-one SES interaction, such as SES by public versus private school, may also require a corresponding level-two interaction to avoid conflating effects.
- Hoffman prefers preparing variables so their within-school and between-school meanings remain explicit, while noting that contextual-effect models directly answer questions about context beyond the individual.
- The class begins Activity Three on the course website, using a small dataset and an R file to fit two models focused on level-two predictors before Homework One.
- R output can be saved with the script's text-start option, submitted as readable text or Markdown, and completed collaboratively with group members identified in the file.
Transcript excerpt
0:01 Okay, so picking back up where we left off in terms of what happens by adding this cluster mean SCES to the model, we have explained now 68.7% of the variance in math based on school SCES. So that's fairly significant. Now can I say that my R square is 68? I cannot. This is of the school variance. So this is 68% of the 18% we started with. However, if I want to just look at the contribution to the total R square, 4.4% was captured by student SCEs, the change that resulted from adding
0:49 school mean SCES is 16%. So it's like four times as impactful relative to predicting math variance. So what school you go to matters a whole lot with respect to your math scores and SCES. All right. Now what if we had just used grand mean centering instead? So this is a new model showing the alternative version of this that you would have uh watched in the video this week and answered questions about in the formative assessment. So rather than going over those questions per se, I think we can integrate them into this context. That way we have something concrete to hang on to. So grand mean centering is the term that everyone uses, but I'm here to tell you it does not matter what constant you pick. That's why I use the term constant
1:37 centering because if you leave it uncentered, that's the same thing as saying you centered at zero. It doesn't matter in terms of what type of effect you're going to get back. All it changes is what your fixed intercept means. So in this model I have one slope for student level SCEs. So it looks on the surface like the first model that we looked at with cluster mean SCEs,
This is the start of the transcript. Save this video free for the whole transcript, searchable and time-coded.
Related notes
Summary, takeaways, and chapters were generated by AI from the video's transcript and may contain errors. The video belongs to its creator, Lesa Hoffman.