EDF9850_Example3_Part3
 Watch on YouTube →
Overview
Lesa Hoffman reviews multilevel-model interaction interpretation, then explains how centering separates within-school and between-school effects in student math models. Using R examples, she shows why a level-one predictor can be conflated, how cluster means reveal contextual effects, and why REML comparisons of fixed effects use Wald tests rather than likelihood-ratio tests or AIC/BIC.
Key takeaways
- For a level-one predictor with within- and between-cluster variation, cluster-mean centering isolates the within effect, while adding the cluster mean estimates a separate between effect.
- A constant-centered level-one model with its cluster mean included yields the within slope and contextual effect; the between slope is the sum of those coefficients.
- The contextual effect tests whether the within and between relationships differ, so a significant contextual coefficient indicates that one shared predictor slope is inadequate.
- Under REML, use Wald tests for fixed-effect comparisons; reserve likelihood-ratio tests for nested random-effect comparisons with the fixed-effects structure held constant.
- For interactions, a reference-group slope is usually a model coefficient, while a slope at another moderator level is a linear combination that includes the relevant interaction.
Chapters
- Lesa Hoffman reports that homework one scores and semester point totals are available in the homework portal.
- The ward dataset has 100 wards and an intraclass correlation of 0.686 for stress, making it useful for practicing level-two predictors.
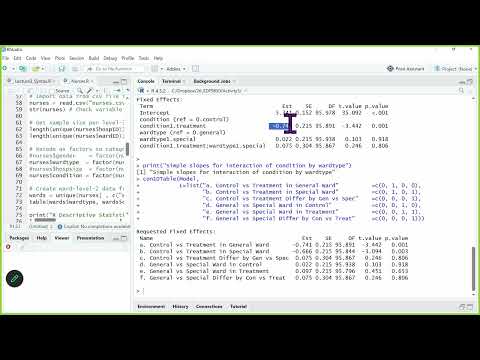
- The exercise examines treatment condition, ward type, and whether treatment effects differ between general-purpose and special-purpose wards.
- Control and general-purpose wards are the reference categories, so the treatment coefficient directly estimates the treatment effect in general wards, about -0.741.
- The treatment effect in special wards requires adding the treatment-by-ward-type interaction to the treatment coefficient, yielding about -0.666.
- The interaction estimates how the treatment effect differs across ward types; its nonsignificance suggests similar effects, though 25 wards per condition combination limits power.
- A main effect tied to a reference group appears directly in the model, while a slope at another moderator level requires a linear combination with the interaction term.
- A two-way interaction can also be interpreted as whether the ward-type difference changes between control and treatment wards.
- For predicted slopes, combine only model terms containing the predictor whose slope is being estimated; predicted outcomes instead require values for every model term.
- A level-one predictor with an ICC between zero and one contains both within-cluster and between-cluster variation.
- An ICC of zero indicates no between-cluster variation, while an ICC of one indicates a purely between-cluster predictor.
- Giving both sources of variation one shared slope can conflate individual and contextual relationships.
- In the student math example, cluster-mean-centered SCES represents each student's socioeconomic status relative to their own school.
- The within-school SCES slope is about 2.2: each unit above a student's school mean corresponds to about 2.2 higher math points.
- This model explains about 5.5% of level-one variance; its small negative level-two pseudo R-squared reflects a slight increase in estimated level-two variance, not a model error.
- Adding school-mean SCES gives the school-level relationship its own slope, about 5.866, while preserving the within-school slope.
- The school mean explains about 68.7% of level-two variance, and the two SCES terms together explain about 16.2% of total math variance.
- The intercept becomes conditional on both a student being average relative to their school and the school being average in mean SCES.
- A constant-centered level-one SCES model without school-mean SCES assigns one slope, about 2.39, to both within-school and between-school associations.
- Adding school-mean SCES separates the effects: the within slope is about 2.19 and the between association is about 5.9.
- The contextual effect is the between slope minus the within slope; in the constant-centered parameterization, the school-mean coefficient directly estimates this contrast.
- Under REML, models that differ in fixed slopes cannot be compared using minus-two log likelihood, AIC, or BIC because the likelihoods are not on the same scale.
- Wald tests evaluate added fixed effects under REML, while likelihood-ratio tests are appropriate for nested comparisons that add random effects while holding fixed effects constant.
- REML is especially useful when the number of level-two units is small; ordinary least squares regression corresponds to REML in the fixed-effect setting discussed.
- The model adds a binary identity predictor with white students as the reference and non-white students as the comparison group.
- The non-white coefficient is about -2.7, conditional on SCES, but this individual-level term assumes school composition has no additional effect.
- Testing that assumption requires adding the school-level proportion of non-white students, rather than relying only on the individual-level coefficient.
- For the binary student predictor, the cluster mean is the school's proportion of students identifying as non-white; Hoffman centers it at 0.3.
- Centering at 0.3 makes the intercept describe a school with 30% non-white students instead of the potentially meaningless case of a school with none.
- After controlling for school composition, the within-school non-white coefficient is about -2.9, while the contextual coefficient is positive and about 1.3 per full proportion unit.
- A significant contextual-effect coefficient tests whether one shared slope is adequate; a nonzero difference between within and between effects means the predictor should not be smooshed.
- The within association of about -2.9 and contextual association of about +1.3 combine to a less-negative between-school association of roughly -1.5.
- Because a full proportion unit spans zero to one, the school-composition effect is easier to explain per 10 percentage-point increase, about 0.14 math points.
Transcript excerpt
0:00 start the recording so we don't forget about that. So, yes, hello officially. Welcome back to my upstairs office and Thursday night class. We are in week five by my count already. I can't believe that it's that much already. We're like a third of the way done. So, yay. I had a chance to update grades this morning. So, if you log into the homework portal, you should be able to see not only your scores on homework one, but also your point totals across all the things that have been collected this semester. So, if you want to take a second and do that if you haven't done so already, that's fine with me. I'll put the the link in the chat just in case. There you go.
0:49 It looked like homework one went reasonably well. Not everyone has turned it in as predicted. This is usually the case. So, I can't answer global questions, but if there's things that you want to follow up on um specifically in terms of why did I miss this or why is this the right answer, I'm happy to tackle those questions as as you need. Did it feel like can we do a thumb check on how homework one went? Okay, that that's my impression too. It's like it was well for the most part and I don't know how many times you entered numbers and they were wrong. So maybe that's where it's not perfectly vertical because I don't keep track of that. I don't need to. But that is the point is try is to keep trying until you get it right. Um I thought it might be helpful to briefly walk through the uh
1:37 activity that we did at the end of last class and that you submitted just to
This is the start of the transcript. Save this video free for the whole transcript, searchable and time-coded.
Related notes
Summary, takeaways, and chapters were generated by AI from the video's transcript and may contain errors. The video belongs to its creator, Lesa Hoffman.