ECO100 - Lecture 11 - F2026
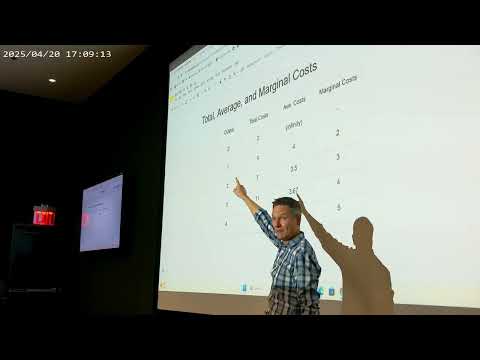 Watch on YouTube →
Overview
Matthew Baker builds a model of perfect competition in which small firms selling similar products take the market price as given, choose output where price equals marginal cost, and enter or exit according to economic profit. Using maple syrup, he shows how entry and exit move the market toward long-run equilibrium at price equal to marginal cost and minimum average cost, then connects that result to efficiency, surplus, and the market power that arises when competitive assumptions fail.
Key takeaways
- A price-taking firm maximizes profit by producing where market price equals marginal cost, because that is where the gain from the last unit matches its additional production cost.
- Positive economic profit attracts entry, shifts industry supply right, and lowers price; economic losses encourage exit, shift supply left, and raise price.
- Long-run competitive equilibrium occurs where price equals marginal cost and minimum average cost, leaving firms with zero economic profit after all opportunity costs are included.
- After maple syrup demand rises, existing producers can initially increase output and earn profits; later entry can raise industry output from about 10,000 to 12,000 bottles while reducing a representative firm’s output from about 30 to 24 bottles.
- Competition can promote both allocative efficiency, producing units whose benefits exceed costs, and productive efficiency, producing at minimum average cost.
- The competitive benchmark relies on small firms, similar products, and feasible entry; relaxing those assumptions can give producers market power over price and quantity.
Chapters
- Matthew Baker frames perfect competition as a benchmark where firms are small, products are similar, and businesses can enter or exit an industry.
- A price-taking firm treats the market price as given and primarily chooses how much to produce, unlike a firm that sets its own price.
- Wheat is an initial example of a relatively standardized product, while maple syrup becomes the lecture’s main industry example.
- Baker notes that current grades, homework, attendance, and exam results are being assembled in Brightspace, with final grades typically curved.
- Total costs include fixed expenditures that a firm incurs even when it produces no output, as in Baker’s oil-rig example.
- Average cost is total cost divided by output; marginal cost measures the added cost of producing another unit.
- Spreading fixed costs across more units lowers average cost initially, while rising marginal costs push average cost up at higher output.
- Marginal cost crosses average cost at its minimum: marginal cost below average cost pulls the average down, while marginal cost above it raises the average.
- A firm increases output when the revenue from an additional unit exceeds its marginal cost, and cuts back when marginal cost exceeds marginal revenue.
- For a price-taking firm, marginal revenue equals the market price, so profit-maximizing output occurs where price equals marginal cost.
- The firm’s profit rectangle has height equal to price minus average cost and width equal to quantity; its area measures total profit or loss.
- Baker’s interactive slider illustrates that the rectangle reaches its maximum at the price-equals-marginal-cost quantity, even when the firm is minimizing losses.
- In the short run, an operating firm chooses output using the price-equals-marginal-cost rule, given its existing capacity and cost curves.
- In the long run, firms decide whether to enter or leave based on whether they expect economic profits or losses.
- Automobile firms such as Ford, Chevrolet, and Tesla adjust production using existing factories in the short run, while opening factories or entering the industry takes longer.
- Restaurants adjust staffing and meals over days or weeks, but opening a new establishment requires a lease, equipment, staff, and permits.
- The industry graph uses capital Q for total market output, while the individual firm graph uses lowercase q for its smaller output.
- Industry supply and demand determine the market price, which becomes a horizontal price line on each price-taking firm’s graph.
- Adding the outputs of many small firms produces total industry quantity; Baker illustrates the relationship with roughly 10,000 weekly maple syrup bottles.
- At a price of $8 per bottle, a representative maple syrup operation produces about 30 bottles per week, implying roughly 333 similar firms.
- When maple syrup firms earn positive economic profit, the profit rectangle signals potential producers that the industry offers an opportunity.
- As new producers enter, the industry supply curve shifts right, lowering the market price.
- At the lower price, each existing firm moves along its fixed marginal cost curve and reduces its profit-maximizing output.
- Total industry output can still rise even as each firm produces less, because the number of maple syrup operations has increased.
- Baker defines economic break-even as earning enough to cover all costs, including the owner’s time, equipment, energy, and raw materials.
- Zero economic profit does not mean a firm has no cash or receives no compensation; it means it earns no return above the full opportunity cost of its resources.
- With no excess profit to attract entrants and no losses prompting exit, the industry can settle into a long-run equilibrium.
- The maple syrup example emphasizes that long-run equilibrium follows the entry response to positive profits, rather than occurring immediately after a demand or price change.
- Suppose research persuades consumers that maple syrup is a healthier substitute for sugar; the resulting increase in consumer preference shifts demand outward.
- In the short run, existing firms respond to the higher market price by increasing output along their supply curves.
- The higher price creates positive profit rectangles for the maple syrup producers already in the industry.
- Those profits encourage entry, which shifts supply outward and eventually pushes price back down.
- After entry, the representative maple syrup firm may produce about 24 bottles per week instead of 30, even as industry output rises from 10,000 to 12,000 bottles.
- Baker’s illustrated price falls from $8 to about $6.50 per bottle as additional firms expand market supply.
- In the long-run competitive equilibrium, price equals marginal cost and average cost, leaving firms with zero economic profit.
- That equilibrium occurs at minimum average cost, so entry and exit push surviving firms toward the lowest feasible per-unit production cost.
- A hypothetical health report linking vaping to unexpected harms shifts demand for vaping products inward.
- The lower market price causes existing firms to reduce output along their marginal cost curves and may leave them with negative economic profit.
- Firms that cannot cover their full economic costs have an incentive to exit in the long run, shifting industry supply left.
- The smaller supply raises price toward the level where remaining firms can again cover average cost and avoid economic losses.
- A demand increase first moves the market along the short-run supply curve, raising both industry quantity and price.
- Over time, entry shifts industry supply outward and moves price back toward the long-run level consistent with firms’ costs.
- Baker sketches long-run supply as flat at the price where firms break even, while short-run supply reflects changes in output from existing firms.
- The short-run versus long-run distinction explains why a temporary period of high prices and profits can coexist with a later return to zero economic profit.
- Consumer surplus is the area below demand and above market price; producer surplus is the area above supply and below price.
- When restaurant demand rises, existing establishments with kitchens and equipment can initially earn extra surplus from their fixed resources.
- Over time, new restaurants and upgraded facilities enter, and competition erodes excess returns as revenues cover the full costs of resources.
- In the long run, what appeared as producer surplus can instead become payments for labor, equipment, locations, and other factors of production.
- With competitive firms producing where price equals marginal cost and consumers choosing where marginal benefit equals price, units with benefits above costs are produced.
- Long-run entry and exit also push production to minimum average cost, combining allocative efficiency with productive efficiency.
- These results depend on the benchmark assumptions that firms are small, products are similar, and entry is possible; a maple syrup producer with exclusive access to all local trees would violate them.
- When those assumptions fail, firms can gain market power, meaning they have some control over both price and quantity; Baker leaves its consequences for the next lecture.
Transcript excerpt
0:01 Lecture 11. Here we go. So, today we're going to talk a little bit about competitive markets. Uh it's an interesting subject and kind of a point where uh some of the I guess ideas of the last couple classes come together. Uh so, I guess there's a lot of ground to cover. Maybe I'll just I'll just dive right in. I think there was something else I wanted to say and I forgot what it was already. Um anyways. Uh just a little bit of bookkeeping. We're now just, you know, and you'll notice we're slowing down a little bit with our progress through the uh through the chapters. So, we're still working through chapter 10 and there's only the two homeworks uh so far for this next uh cycle. Oh, here it is. Uh so, some people have asked about various homework grades and how some of the homework grading is
0:47 incomplete and all of that stuff. I think I have more or less worked my way through not all, but the vast majority of exam corrections and all of that. Uh and I'm going to go back through all the homework grades and all of that stuff. My plan is to begin this process by which I assemble your grades as they now stand and get them all into Brightspace. Uh I'm going to do that this afternoon now that the dust has mainly settled. Uh so, at that point you can look at your, you know, grades in Top Hat. Everything should be up in Brightspace, attendance, um all the homework, your exam, and maybe even like a rolling average as to where you stand in the class uh right now. Some of you have also asked about grades and things like that.
1:35 Um I tend to curve the final grades. So, uh
This is the start of the transcript. Save this video free for the whole transcript, searchable and time-coded.
Related notes
Summary, takeaways, and chapters were generated by AI from the video's transcript and may contain errors. The video belongs to its creator, Matthew Baker.