ECO 100 - Lecture 5 - F2026
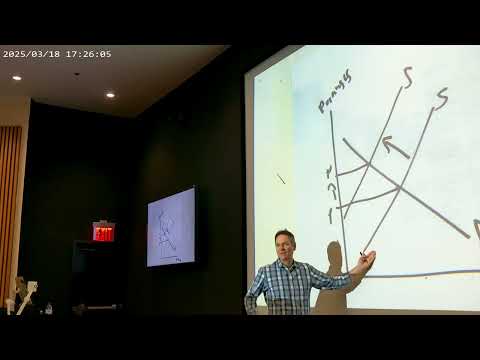 Watch on YouTube →
Overview
Matthew Baker uses supply-and-demand diagrams to explain how real-world events shift market equilibria, from bird flu and higher feed costs raising chicken prices to AI changing both mortgage demand and supply. He then connects demand to diminishing marginal utility, showing how individual willingness to pay builds a demand curve and how areas under that curve represent total consumer benefit.
Key takeaways
- A chicken price increase cannot be attributed to demand from price data alone: avian flu and higher feed, fuel, labor, and processing costs can shift supply left and produce the same higher-price result.
- When AI expands both mortgage demand and lender supply, the direction of mortgage rates is ambiguous, but the equilibrium volume of mortgages should increase.
- Simultaneous supply and demand shifts can raise quantity while leaving price uncertain, as in seasonal markets for Thanksgiving turkeys and Valentine's Day roses.
- A consumer's demand curve can be derived from marginal benefits: Jacob's pizza values of $8, $6, $4, and $2 determine how many slices he buys at each price.
- The area under a demand curve up to the quantity purchased represents total consumer benefit; the portion above the market price is consumer surplus.
- The impact of a supply restriction on illicit-drug expenditure depends on demand elasticity: shifting supply left can shrink total spending when demand is elastic, while expanding supply may work better when demand is inelastic.
Chapters
- Matthew Baker introduces an optional extra-credit-style exercise using price series from FRED, the economic data website.
- Students choose a product, identify a large price change, research what may have caused it, and illustrate the explanation with supply-and-demand shifts.
- The assignment applies comparative statics from the previous two classes and asks students to find an example that feels distinctive.
- A boneless chicken breast price series shows a sharp increase around 2022 to 2023.
- Baker uses Perplexity to investigate possible causes, including avian flu, fuel and labor costs, and expensive animal feed.
- These production difficulties shift chicken supply left, raising the equilibrium price; a demand increase could also raise price, so price data alone does not identify the cause.
- A heavy frost in Florida makes oranges harder to grow, shifting orange supply left.
- At the original price, quantity demanded exceeds quantity supplied, creating a temporary shortage that pushes price toward a higher equilibrium.
- The predicted result is a higher orange price and a lower equilibrium quantity.
- Baker treats a mortgage interest rate as the price of borrowing money, with homebuyers demanding mortgages and financial firms supplying them.
- AI may expand mortgage demand by making applications and paperwork more accessible to borrowers who previously faced barriers.
- AI may also shift mortgage supply outward by improving lender efficiency, loan processing, and risk assessment.
- The combined shifts make the direction of mortgage rates uncertain, but predict a larger volume of mortgages exchanged.
- Thanksgiving expands both turkey demand and supply; Baker's diagram shows quantity rising while price can fall if supply expands sufficiently.
- Grocery stores may use turkeys as loss leaders, selling them cheaply to attract shoppers who also buy gravy, stuffing, and other goods.
- Valentine's Day raises demand for roses, while supply also expands; Baker illustrates an outcome with both quantity and price higher.
- Baker notes that the different seasonal supply responses for turkeys and roses deserve further investigation.
- The rectangle formed by equilibrium price and quantity, P × Q, represents total expenditure on a product and revenue received by its sellers.
- A policy that shifts illicit-drug supply left may shrink that rectangle when demand is relatively elastic, but its effect depends on demand responsiveness.
- When demand is steep and relatively inelastic, expanding supply through legalization may reduce total expenditure more effectively.
- Baker connects the logic to a reported Australia or New Zealand tobacco policy that restricts cigarette purchases for younger cohorts.
- Baker introduces marginal benefit as the value someone receives from consuming one additional unit of a good.
- Consumers decide whether to buy by comparing that unit's benefit with its price; a coffee worth $6 to a consumer is worth buying at $4.
- Economists use this rational-choice model as a useful guide even though people rarely perform the calculation explicitly.
- As someone consumes additional cups of coffee in a given period, each extra cup typically provides less benefit than the previous one.
- Utility is the economic term Baker uses for benefit, so diminishing marginal utility means the benefit of each additional unit declines.
- Past consumption and habit formation can affect how much a person values coffee, but Baker sets those complications aside for the basic model.
- Baker assigns Jacob marginal benefits of $8, $6, $4, and $2 for his first through fourth pizza slices.
- At a price of $7.50, Jacob buys one slice; at $5, he buys two because the first two slices are each worth at least the price.
- Comparing each slice's marginal benefit with price determines how many slices Jacob demands, so his demand curve traces out those marginal benefits.
- Jacob's total benefit from three slices is $18, the sum of the $8, $6, and $4 marginal benefits.
- Lowering a price until Jacob first buys a slice reveals an approximate willingness to pay: buying when the price falls just below $8 indicates an $8 marginal benefit.
- A Dutch auction uses the same descending-price logic: a clock lowers the price until a buyer accepts.
- Baker notes that large quantities of flowers are sold through Dutch auctions in Amsterdam.
- Different buyers' demand curves also help explain why stores offer different package sizes at different unit prices, a form of price discrimination.
- At a market price, every unit purchased before the last one provided its consumer with a marginal benefit greater than or equal to that price.
- For a market example of 10,000 pizzas, the area under the demand curve up to 10,000 units represents consumers' total benefits.
- Baker previews consumer surplus as the area above the market price and below demand, measuring satisfaction beyond what buyers pay.
- The lecture ends with total utility and consumer surplus as the next step in interpreting the geometry of supply and demand.
Transcript excerpt
0:00 Okay, so I think all systems are go now. Um, there's the information for posterity sake if you want in uh to I encourage you to do that. I also do have the cards here for you. Um, and I will add it to the uh the slide deck. But here we go with uh with lecture five. Now, usually uh you know, we start off with the usual bookkeeping stuff here. So, we have quite a bit of stuff up there, but once again, it looks like a the homework. It looks like a lot, but they're pretty quick once you get into them. There's, I think, six of them up now. Um, chapters six and into seven. It's fairly easy reading, but it's getting to be all all up there. I'll show you in a second. I have to do verification of attendance uh for your financial aid and stuff like
0:47 that. I have to get that done. I put it off as long as possible. Uh, so it's your last chance, I think, to either sign up for Top Hat or tell me about why tell me about something about your situation, why you haven't. Um, and also we don't have class this coming Monday, right? So, I'm seizing this opportunity to maybe put a little idea in your mind that will keep you just thinking about our class uh over the next week. So, anyways, today is the 16th, no class the 21st. So then we kind of have it's like we're sort of three weeks out now from this exam, right? I guess it's three weeks from today. So just you know and once again we'll do the usual thing couple more lectures review materials review and then exam um and we'll it's sort of
This is the start of the transcript. Save this video free for the whole transcript, searchable and time-coded.
Related notes
Summary, takeaways, and chapters were generated by AI from the video's transcript and may contain errors. The video belongs to its creator, Matthew Baker.