ECO100 - 8.5 - F2026 - Exam Review
 Watch on YouTube →
Overview
Matthew Baker reviews ECO100 exam material on supply and demand, market equilibrium, consumer and producer surplus, price controls, and taxes. He works through practice-exam diagrams and online questions, emphasizing how to distinguish a curve shift from movement along a curve, calculate triangle areas, and determine tax incidence from supply and demand elasticities.
Key takeaways
- A good’s own price changes quantity demanded or quantity supplied along an existing curve; factors such as income, input costs, weather, or related-good prices shift the curve.
- A binding $150 rent ceiling in the example creates a shortage because quantity demanded is 500 while quantity supplied is 300.
- Surplus areas can be calculated with triangle geometry: the egg-market example produces consumer surplus of 800 and producer surplus of 1,600.
- A $100 Chromebook tax results in a $100 gap between the consumer price of $250 and the supplier price of $150, with 300 units traded.
- Tax incidence depends on elasticity, not simply on who is legally required to remit the tax; the steeper, less elastic side bears more of its burden.
- For an inferior good such as the coconut example, falling income shifts demand outward; at a price below equilibrium, quantity demanded exceeding quantity supplied indicates a shortage.
Chapters
- The in-class exam is scheduled for October 7, and all eight homework problem sets are due October 9.
- Four-function and basic scientific calculators are permitted, but calculators with memory functions and phones are not allowed.
- Students may leave when finished but cannot leave and return during the exam; Baker stresses that taking a zero is preferable to cheating.
- The exam covers lectures, readings, and problem sets from the course’s first eight chapters.
- Core skills include interpreting a linear production possibilities frontier, shifting supply and demand curves, and finding new equilibria.
- Baker says the exam tests whether students can identify consumer and producer surplus and calculate areas when markets are affected by policy.
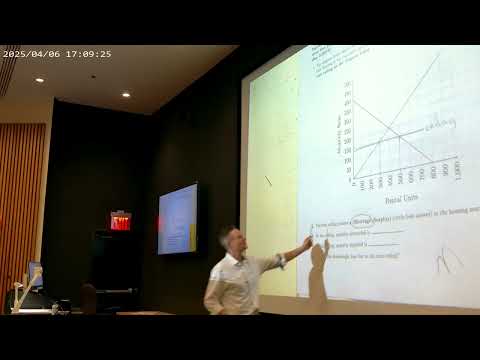
- A rent ceiling of $150 is drawn as a horizontal price line on the housing supply-and-demand graph.
- At that ceiling, quantity demanded is 500 and quantity supplied is 300, creating a shortage.
- Assuming the 300 available apartments go to the highest-value renters, the deadweight-loss triangle has height 250 minus 150, or 100, and base 400 minus 300, or 100.
- The resulting deadweight loss is 100 × 100 ÷ 2, or 5,000.
- A $100 Yankees ticket plus $100 in forgone wages makes the opportunity cost of attending the game $200.
- A Florida freeze, higher orange-picker wages, and improved irrigation technology shift orange supply: the first two reduce supply, while better irrigation increases it.
- A change in the price of oranges changes quantity supplied along the existing curve; a change in wages shifts the curve because labor is an input cost.
- Because coffee and sugar are complements, an increase in sugar’s price reduces demand for coffee and shifts its demand curve left.
- A decrease in sugar’s price has the opposite effect, shifting coffee demand right.
- A change in coffee’s own price moves consumers along the coffee demand curve and changes quantity demanded, rather than shifting demand.
- The law of increasing costs means producing more of a good requires using resources progressively less suited to its production, raising the cost of additional units.
- Baker illustrates the idea with land suited to different uses, such as flat land for wheat and hilly land for livestock.
- An individual demand curve slopes downward because each additional unit provides less marginal benefit, so consumers are willing to pay less for it.
- Changes in a good’s own price are represented as movement along its curve; other demand determinants shift the curve.
- At equilibrium, consumer surplus is the triangle below demand and above the $4 market price: base 800, height 6 minus 4, giving an area of 800.
- Producer surplus is the triangle above supply and below the market price: base 800, height 4, giving an area of 1,600.
- At an egg price of $5, quantity supplied is 1,000 and quantity demanded is 400, so the market has a surplus of 600.
- Baker recommends labeling supply and demand curves and keeping calculations separate from the answer area for easier grading.
- Colder-than-usual Caribbean weather reduces demand for spring-break air travel, shifting demand from D2 to D3 and moving equilibrium from E to H.
- A health report about avocados shifts demand outward from D2 to D1, while more expensive agricultural land shifts supply left.
- With both avocado-market shifts, the illustrated equilibrium moves from E through B to A; the price rises, while the net quantity change is uncertain.
- Baker says the exam will resemble the practice exam in structure, while changing examples and numerical values; it will contain about 20 questions.
- For a $100 tax on Chromebooks, shifting supply upward by the tax produces a new traded quantity of 300.
- At that quantity, consumers pay $250 and suppliers receive $150, so the difference between their prices equals the $100 tax.
- The same equilibrium can be found by shifting demand downward by $100 or by placing a $100 tax wedge between the prices consumers pay and suppliers receive.
- Baker says the exam question should specify whether the tax is legally levied on consumers or suppliers when students are asked to shift one particular curve.
- A tax wedge must equal the vertical difference between the consumer price and supplier price; increasing the tax to $150 requires a $150 gap.
- Splitting a tax evenly between buyers and sellers is generally incorrect because the result depends on the slopes of supply and demand.
- The less elastic, steeper side of the market bears more of the tax, while the more elastic, flatter side bears less.
- Baker revisits the avocado question by separating the outward demand shift from the leftward supply shift before identifying the final equilibrium.
- In a supply-curve reading question, quantity supplied of six units corresponds to a price of $3.
- At a price of $4, producer surplus is the triangle below price and above supply, with base 8 and height 4: 8 × 4 ÷ 2 = 16.
- A harder practice question asks how producer surplus changes when supply shifts from S1 to S2; Baker breaks it into labeled areas and notes a discrepancy in his initial calculation and the answer key.
- At a price of 20, the consumer-surplus triangle has base 10 and height 20, producing an area of 100.
- When price falls from 30 to 20, Baker compares the two surplus areas: 25 at the higher price and 100 at the lower price.
- Consumer surplus therefore increases by 100 minus 25, or 75.
- When price falls from P1 to P2 on a diagram, consumer surplus expands from area A to A plus B plus D, so the increase is B plus D.
- The cost of labor used to produce good X determines supply, while consumer income and the price of a related good can shift demand for X.
- Good X’s own price determines quantity demanded along a given demand curve, rather than determining the position of the demand curve.
- For inferior coconuts, a decrease in consumer income shifts demand outward; the diagram’s valid shift is A to C, not a movement along a curve.
- At a price of $6, below the equilibrium price of $10, quantity demanded is 230 and quantity supplied is 90, creating a shortage of 140.
Transcript excerpt
0:00 Oh, 10:02. All right, I guess we'll get started uh here today. We have uh our review for our exam coming Wednesday. Um I know it seems like I'm making a big deal of it. It's It's not really that big of a deal, but uh you know, I just feel like we have to, you know, know what the system is and all be on the same page and all of that stuff. So yeah, my plan is to just go over those practice materials that I handed out last time and then spend a little bit of time, whatever time we have remaining on uh just doing some of the online top hack questions. It looks like about half of you, well I think about 60 people did all 60 questions. So I appreciate that. It'll help out a little bit and we'll just take it from there. Um, okay. So, just to remind you, uh, next time October 7th, in class, we're coming
0:49 here to take the exam. I don't, maybe that's obvious, but I feel like, uh, you know, I don't want to take anything for granted here. Uh, you you have until Friday, October 9th, to finish all the homework. There's eight problem sets. Uh, no cheating. That's a big big rule, I guess. Uh, one thing I'll say is that usually anything, you know, even if you walked in and did nothing on the exam and took a zero, uh, um, that would be a far better outcome for you in the class than cheating and getting caught. Uh, just to kind of think about the relative costs and benefits of those uh, two things. Four function calculators. So, this is, you know, you know what the four functions are. that's uh those are
This is the start of the transcript. Save this video free for the whole transcript, searchable and time-coded.
Related notes
Summary, takeaways, and chapters were generated by AI from the video's transcript and may contain errors. The video belongs to its creator, Matthew Baker.