Lecture 13 - Enthalpy, Pt. 1
 Watch on YouTube →
Overview
Nathan Seifert uses gas–liquid behavior to motivate phase diagrams and introduces enthalpy, H = U + PV, as a useful state function for constant-pressure chemistry. Examples involving calcite and aragonite, acid–base reactions, and hydrogen combustion illustrate how the pressure–volume work term compares with chemical energy; the lecture then connects gas–liquid coexistence to the critical point.
Key takeaways
- Enthalpy is defined as H = U + PV; at constant pressure, ΔH equals heat transfer when pressure–volume work is the only work mode.
- The correct constant-pressure temperature derivative is (∂H/∂T)ₚ = Cₚ, not entropy; the lecture’s spoken derivation states the derivative incorrectly.
- For calcite-to-aragonite conversion, the density-based volume change gives PΔV ≈ −0.277 J/mol at 1 bar, far smaller than the cited ΔU of about 21 kJ/mol.
- For ideal gases at fixed temperature, the pressure–volume contribution can be estimated as Δn₍gas₎RT; three fewer gas moles at 298 K correspond to about −7.4 kJ per reaction as written.
- A 7.4 kJ pressure–volume contribution compared with roughly 560 kJ is about 1.3%, not the lecture’s stated 50%; the numerical interpretation is internally inconsistent.
- The gas–liquid coexistence curve ends at a critical point, beyond which liquid-like and gas-like states connect continuously; enthalpy can still vary along that smooth path.
Chapters
0:00
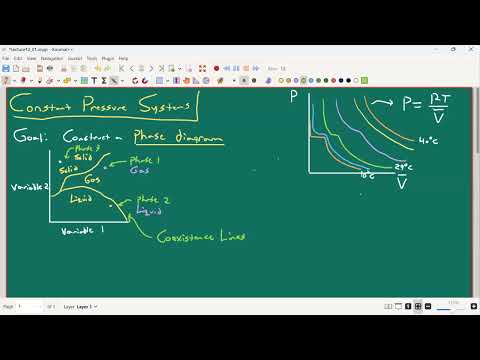
Gas Compression Reveals the Liquid Phase
- At high temperature, pressure rises as gas is compressed, approximately following ideal-gas behavior.
- At lower temperatures, a flat region appears in the pressure–volume curve as added material enters a liquid phase rather than increasing gas pressure.
- Liquids resist compression: unlike a balloon, a water-filled container expands or ruptures rather than appreciably shrinking.
5:30
Building a Phase Diagram from Coexistence Lines
- A phase diagram assigns the stable phase—solid, liquid, or gas—to each combination of two variables such as pressure and temperature.
- Boundaries between regions are coexistence lines, where competing phases can exist together.
- The lecture previews a critical temperature and pressure beyond which the liquid phase does not appear.
13:15
A Constant-Pressure Flask Setup
- A sample in a temperature-controlled bath is left open to an external atmosphere, allowing vapor or air to move in and out.
- Exchange with the surroundings keeps the sample pressure approximately equal to the external pressure.
- Unlike a sealed, constant-volume container, heating can release vapor without allowing pressure to build indefinitely.
18:20
From Internal Energy to a Constant-Pressure Description
- Seifert starts from the thermodynamic differential dU = T dS − P dV + μ dN.
- Because vapor can leave an open sample and volume work matters, changes in internal energy alone are not the most convenient description.
- The lecture seeks a state function that accounts for the pressure–volume contribution in constant-pressure experiments.
20:00
Defining Enthalpy as H = U + PV
- Enthalpy is defined as H = U + PV, combining internal energy with the pressure–volume term.
- At constant pressure, changes in H are useful for tracking heat transfer when pressure–volume work is the only work mode.
- This makes enthalpy a practical quantity for reactions and phase changes conducted in open vessels.
24:10
Why Enthalpy Is Useful—and the Heat-Capacity Relation
- The lecture’s motivating idea is that adding PV to U accounts for expansion work in constant-pressure processes.
- For a process at constant pressure with only pressure–volume work, the standard relation is ΔH = qₚ.
- The transcript’s derivation incorrectly identifies (∂H/∂T)ₚ with entropy; the correct derivative is the heat capacity at constant pressure, Cₚ.
31:40
Reaction Enthalpy and the Work Assumption
- An HCl–NaOH neutralization is used to illustrate an exothermic reaction whose heat release is measured through ΔH at constant pressure.
- Comparing reactants and products also requires considering whether their pressure–volume work differs.
- For many reactions in aqueous solution, similar liquid volumes make the PΔV contribution small compared with chemical-energy changes.
34:30
Calcite and Aragonite: Estimating the PΔV Contribution
- Calcite and aragonite are two crystal forms of CaCO₃; their cited densities are 2.71 and 2.93 g/mL, respectively.
- Using a molar mass near 100.09 g/mol gives a molar-volume change of about −2.77 mL/mol when converting calcite to denser aragonite.
- At 1 bar, PΔV is about −0.277 J/mol, negligible beside the cited internal-energy change of roughly 21 kJ/mol.
43:00
When PΔV Is Small—and When Phase Changes Matter
- For transformations within a single liquid phase, the lecture argues that density changes are often small, so ΔH is close to ΔU.
- Boiling is different: a liquid-to-gas transition produces a large volume change and can make pressure–volume work significant.
- Separating heat effects from volume work becomes especially important when a process crosses between phases.
55:30
Hydrogen Combustion and Gas-Mole Changes
- The hydrogen-fuel example describes hydrogen reacting with oxygen to form water, with water as the intended exhaust product.
- For ideal gases at fixed temperature, PΔV is related to the change in gas moles through Δn₍gas₎RT.
- The lecture estimates a magnitude near 7.4 kJ for a change of three gas moles at 298 K; compared with about 560 kJ, that is roughly 1.3%, not the claimed 50%.
1:02:00
Phase Changes Require Energy and Work
- Seifert emphasizes that condensation and vaporization involve energetic changes rather than being cost-free rearrangements.
- A coexistence line represents conditions where two phases can be present together, such as gas and liquid.
- The amount of heat and pressure–volume work depends on the phases and the path through pressure–temperature space.
1:05:00
The Gas–Liquid Coexistence Line Ends at a Critical Point
- The pressure–temperature sketch places gas and liquid on opposite sides of a gas–liquid coexistence curve.
- The curve terminates at a critical point, where the distinction between liquid and gas disappears.
- Above the critical point, the material is a supercritical fluid rather than a separate gas or liquid phase.
1:09:00
Crossing a Coexistence Line Versus Passing the Critical Point
- Crossing the gas–liquid coexistence line below the critical point produces a first-order phase change such as boiling or condensation.
- Passing around the critical point can connect liquid-like and gas-like states smoothly, without a distinct coexistence boundary.
- The transcript claims enthalpy does not change along this smooth route; thermodynamically, enthalpy generally changes continuously and is not necessarily constant.
1:12:00
Preview: Classifying Phase Transitions
- The lecture distinguishes ordinary transitions across coexistence lines from smooth changes through the region beyond the critical point.
- Seifert previews calculating coexistence lines and comparing the physical behavior of boiling with changes near the critical point.
- The next class is set to examine the thermodynamics and observable differences between these transitions.
Summary, takeaways, and chapters were generated by AI from the video's transcript and may contain errors. The video belongs to its creator, Nathan Seifert.