GERO 200 f2026 How to write CT1 Video 2026 09 19 1
 Watch on YouTube →
Overview
John Walsh explains the GERO 200 Critical Thinking Assignment 1: students must use Our World in Data to compare the United States, one developing country, and one other country through three charts on life expectancy, healthcare spending, and spending versus longevity. His examples compare the United States, South Korea, and Costa Rica, highlighting roughly $12,000 in annual U.S. health spending per person versus about $4,000 in South Korea, alongside lower U.S. life expectancy, and he stresses rubric compliance, correct file submission, and transparent AI disclosure.
Key takeaways
- CT1 requires three country comparisons: the United States, one developing country, and one additional country, with the choices and rationale stated in the paper.
- All three required charts must come from Our World in Data and cover life expectancy, healthcare spending, and spending in relation to life expectancy.
- Walsh's examples show annual per-person health spending of about $12,000 in the United States and $4,000 in South Korea, while the displayed life expectancies are 79.3 and about 84 years, respectively.
- The Costa Rica example pairs life expectancy roughly 1 to 1.5 years above the U.S. figure with health spending under one-eighth of U.S. spending per person.
- Students must disclose the AI tool used and how it helped; undisclosed AI-generated work presented as original is plagiarism and may cost 25% of the grade.
- A valid submission must be a PDF uploaded to Turnitin, and students should reopen it to verify the file contains the paper rather than a blank document.
Chapters
0:00
Assignment Deadlines, Turnitin Uploads, and AI Disclosure
- The discussion and quiz are due Monday the 21st at 11:59 p.m.; the first writing assignment is due Wednesday.
- The first three weeks of quizzes and discussions remain open, but fourth-week work follows its official deadline; students can return to fix earlier posts.
- Submit a PDF rather than an Apple Pages file, then reopen the Turnitin submission to confirm the document is not blank.
- Disclose any AI tool used and explain its purpose; presenting AI-generated work or prompts as original work counts as plagiarism.
4:40
CT1 Rubric: Three Countries and Three Our World in Data Charts
- Choose the United States, one developing country such as Costa Rica, and one other country such as South Korea; explain the country choices.
- Create three charts using Our World in Data: life expectancy over time, healthcare spending, and healthcare spending compared with life expectancy.
- Use the assignment rubric to explain trends and possible causes, including major historical dips such as the 1918 influenza pandemic, World War II, and COVID-19.
- Discuss why U.S. healthcare spending is high and whether that spending produces better health outcomes; charts from other websites do not meet the stated requirement.
11:15
Our World in Data Demonstration: U.S., South Korea, and Costa Rica
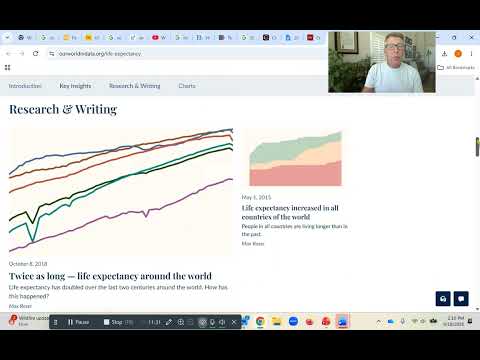
- Walsh selects the United States, South Korea, and Costa Rica in Our World in Data and demonstrates the life-expectancy comparison.
- The example shows U.S. health spending at roughly $12,000 per person, compared with about $4,000 in South Korea; South Korea's life expectancy is about 84 years versus 79.3 in the United States.
- Costa Rica's life expectancy is shown as roughly one to one-and-a-half years higher than the U.S. figure, while its per-person spending is less than one-eighth of U.S. spending.
- Use the three charts as evidence, then explain differences in spending efficiency and healthcare systems, including Costa Rica's form of socialized medicine.
Summary, takeaways, and chapters were generated by AI from the video's transcript and may contain errors. The video belongs to its creator, John Walsh.