fnb100f261015
 Watch on YouTube →
Overview
Jeff Hunk explains how the balance sheet depicts a company’s capital structure and use of funds, using a hypothetical $10 billion manufacturer with $9.5 billion in plant and equipment and $0.5 billion in current assets. He connects balance sheets to income statements, explains working capital and leverage, and introduces EPS, ROE, and an asset-return measure that accounts for interest.
Key takeaways
- A balance sheet balances sources of capital—liabilities and equity—against uses of capital—assets; in the manufacturer example, $10 billion raised must be represented by $10 billion in assets.
- The hypothetical manufacturer allocates $9.5 billion to long-term physical assets and $0.5 billion to current assets, illustrating why equipment alone cannot fund wages, materials, and other startup operating needs.
- Current assets include more than cash: cash equivalents, other companies’ marketable securities, promissory notes, accounts receivable, and inventory can all support operations or provide liquidity.
- Jeff Hunk recommends a current ratio of 2, calculated as current assets divided by current liabilities, because a ratio of 1 could leave no working capital after short-term obligations are paid.
- Income statements describe operating results over a period, while balance sheets are snapshots; comparing time-zero and time-one balance sheets alongside the period’s income statement shows how operations change company resources.
- Debt can amplify shareholder returns but increases interest and default risk; Jeff Hunk identifies an approximate 30–40% debt and 60–70% equity range as an optimal capital-structure zone and defines EPS as EAT divided by shares outstanding.
Chapters
0:00
Class Updates, Repeated Lecture, and Quiz 1 Requirements
- Jeff Hunk notes that he accidentally repeated material on operating activity and fixed versus variable costs already covered on October 1.
- He says the Tuesday/Thursday section must catch up with the Monday/Wednesday sections.
- Quiz 1 begins the next day; students are told to check video-release requirements and use Jeff Hunk’s YouTube channel for videos whose course windows have closed.
5:00
Income Statements Measure Profit; Balance Sheets Describe Capital Structure
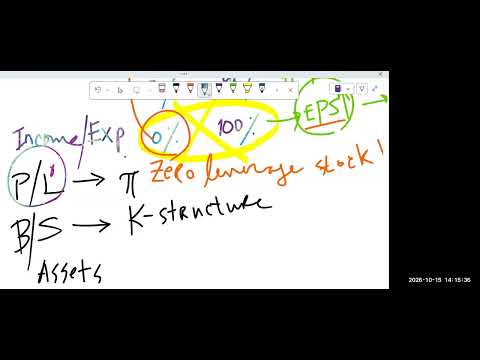
- The income statement, also called the P&L or profit-and-loss statement, reports the process of income and expenses and its resulting profit or loss.
- The balance sheet’s purpose is to describe capital structure by showing assets opposite liabilities and equity.
- The two balance-sheet sides must balance: assets equal debt plus equity.
10:00
The Balance Sheet as Sources and Uses of Capital
- Liabilities and equity show the sources of a company’s capital; assets show how that capital is used.
- A manufacturer such as the hypothetical computer company needs a factory, land, buildings, and production equipment before it can make products.
- A factory costing $9.5 billion must be financed through capital sources such as issuing bonds, borrowing from a bank, or selling stock.
16:00
Classifying Long-Term Capital, Debt, and Physical Assets
- The example raises $10 billion in total, with $9.5 billion treated as long-term capital and $0.5 billion as short-term liabilities.
- Bonds and other long-term borrowing are debt, classified as long-term or non-current liabilities; a bank mortgage may be secured by land and buildings.
- Plant and equipment are long-term, non-current, fixed, physical, or real assets.
23:00
Current Assets, Liquidity, and Marketable Securities
- The remaining $0.5 billion is held as current assets, which Jeff Hunk also describes as liquid or financial assets.
- Current assets can include cash, cash equivalents, marketable securities, promissory notes, accounts receivable, and inventory.
- Marketable stocks and bonds are securities of other companies, not the manufacturer’s own stock or bonds; they can earn returns instead of sitting idle as cash.
28:00
Working Capital Funds Production Before Sales Revenue Arrives
- Current assets are also called working capital because the company needs them before producing and selling its first goods and collecting revenue.
- The $9.5 billion in factory assets cannot pay workers or buy raw materials, so the business needs liquid funds to start operations.
- Manufacturing inventory has three forms: raw materials, work in progress, and finished goods; Jeff Hunk says finished goods should leave the factory through sales.
34:00
Current Liabilities and the Current-Ratio Guideline
- Current liabilities are short-term obligations that the company pays using current assets and working capital.
- The current ratio is current assets divided by current liabilities; Jeff Hunk gives 2 as the target threshold.
- A ratio of 1 leaves no working capital after paying current liabilities, potentially limiting the company’s ability to buy raw materials or pay workers.
36:00
Returns, Allowances, and Net Sales Revenue
- Gross sales revenue is reduced by returns, which require refunds, and allowances, which function as business-to-business discounts.
- Manufacturers may offer retailers volume discounts or discounts for paying promissory notes early.
- Jeff Hunk uses negative entries for returns and allowances in his spreadsheet example so that an auto-sum calculation subtracts them to produce net revenue.
45:00
Connecting Income-Statement Activity to Balance-Sheet Snapshots
- A complete view uses balance sheets at time zero and time one, plus an income statement covering the operating period between them.
- Balance sheets are static snapshots; the income statement records activity over the interval and helps explain how the company’s position changes.
- Revenue may increase cash, promissory notes, or accounts receivable at time one, depending on how customers paid; credit balances are eventually collected in cash.
49:00
Capital Structure: Debt and Equity Mix
- Jeff Hunk illustrates capital structure with a hypothetical $10 billion in assets financed by $5 billion of debt and $5 billion of equity: a 50/50 mix.
- Other possible mixes include 90% debt and 10% equity or 30% debt and 70% equity.
- Excessive debt raises interest costs and default risk, which can lead to bankruptcy; zero debt may also forgo the benefits of leverage.
57:00
Leverage, Optimal Capital Structure, and Earnings per Share
- Jeff Hunk places the empirical optimal capital structure in the approximate range of 30–40% debt and 60–70% equity.
- Using debt is leverage; at an appropriate level, leverage can help maximize earnings per share (EPS) and return on equity (ROE).
- EPS equals net profit, or earnings after tax (EAT), divided by shares outstanding; $2 billion of EAT divided by 100 million shares produces $20 per share.
1:03:00
ROE and Total-Asset Returns: Matching Earnings to the Capital Base
- ROE is EAT at time one divided by equity at time zero, comparing the period’s profit with the equity invested at the start.
- Jeff Hunk uses a tree-and-harvest analogy: the initial equity is the tree, and the profit earned later is its fruit.
- Because lenders receive interest rather than a share of profits, a total-asset return measure uses an earnings figure that includes the effect of interest, rather than EAT alone.
1:06:00
Quiz 1 Opening Time, Deadline, and Course Support
- Quiz 1 opens at 12 a.m. (midnight) and is due Sunday.
- Students can contact Jeff Hunk about problems with video-release requirements; he directs them to check the listed release conditions.
- The class ends with a reminder to complete the quiz and a note that the next meeting is Tuesday.
Summary, takeaways, and chapters were generated by AI from the video's transcript and may contain errors. The video belongs to its creator, Jeff Hunk.