fnb100f261014b
 Watch on YouTube →
Overview
Jeff Hunk introduces the balance sheet as a view of capital structure: assets show how capital is used, while liabilities and equity show whether it came from debt or shareholders. He works through leverage risk, book value per share, earnings per share, ROE, and ROA, then closes with quiz-release reminders and a question about how companies choose how many shares to issue.
Key takeaways
- The balance sheet balances because assets are financed by only two broad sources: liabilities (debt) and equity.
- High leverage increases required interest payments, making default and financial distress more likely if the company cannot service its debt.
- Book value per share is balance-sheet equity divided by outstanding shares; it is not necessarily the same as market price.
- EPS equals earnings after taxes divided by shares outstanding; $1 billion of EAT across 50 million shares yields $20 per share.
- ROE compares net income with equity, while EBIT is useful for ROA because it includes earnings before interest claims are paid to debt holders.
- Companies may retain earnings for capital expenditures instead of distributing all profits as dividends.
Chapters
0:00
Class Roll Call and Attendance Checks
- Jeff Hunk checks attendance and asks students, including Cortez Harris, to correct how their names appear in the roster.
- Students are asked to turn on cameras; Jeff takes a screenshot to document class engagement.
6:00
The Balance Sheet Shows Capital Structure
- Jeff distinguishes the income statement's focus on profit from the balance sheet's focus on capital structure.
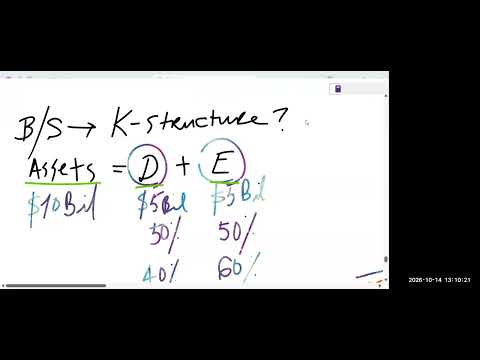
- Assets appear on one side; liabilities and equity show the two sources—debt and shareholder capital—that finance them.
- The accounting equation requires assets to equal liabilities plus equity.
9:00
Debt–Equity Mix and the Risks of Extreme Leverage
- For a company with $10 billion in assets, $5 billion of debt and $5 billion of equity represent a 50/50 capital structure.
- Other hypothetical mixes include 40% debt/60% equity and 90% debt/10% equity.
- At 100% debt and 0% equity, no shareholders remain as owners; Jeff describes that structure as unrealistic and nonviable.
12:00
Why Heavy Debt Raises Default and Bankruptcy Risk
- When debt is nine times equity, the company faces a high burden of interest payments and greater financial distress.
- If a company cannot meet interest obligations, it risks default and bankruptcy.
- Jeff contrasts excessive debt with zero debt, presenting roughly 30–40% debt and 60–70% equity as a possible optimal range in his explanation.
20:00
Optimal Capital Structure, EPS, and Dividends
- Jeff defines optimal capital structure as the mix associated with maximizing earnings per share (EPS) and return on equity (ROE); finding it mathematically is outside the course scope.
- EPS is net income (EAT) divided by the number of shares outstanding.
- A dividend is only a portion of earnings paid to shareholders; companies can retain earnings to fund capital expenditures and expansion.
26:00
Retained Earnings, Book Value, and Market Price
- Jeff explains that shareholders can realize value by selling shares, while company profits may be retained rather than distributed.
- Book value per share comes from the equity recorded on the balance sheet divided by shares outstanding.
- Market price can diverge from book value: positive expectations may increase buying demand and price, while negative expectations may push price lower.
30:00
How Capital Becomes Physical Assets and Working Capital
- In a $10 billion example, $5 billion of equity and $5 billion of debt finance the company's assets.
- A manufacturer might convert about $9 billion into plant, equipment, buildings, and land, with the remainder held as working capital.
- The balance sheet links capital sources—liabilities and equity—to capital uses on the asset side.
36:00
Calculating Book Value and Earnings per Share
- With $5 billion of recorded equity and 50 million shares, book value is $100 per share.
- If the company earns $1 billion in EAT with 50 million shares outstanding, EPS is $20 per share.
- Jeff distinguishes the balance-sheet book value calculation from market pricing and connects EPS to the number of outstanding shares.
40:00
ROE, ROA, and the Profitability of Company Assets
- With $1 billion of net profit and $5 billion of equity, ROE is 20%, measuring net income relative to shareholder capital.
- Jeff compares equity to an apple tree and EAT to its fruit to illustrate the productivity measured by ROE.
- Because EAT belongs to shareholders while interest belongs to debt holders, Jeff identifies EBIT as a more appropriate numerator for ROA when evaluating returns to all capital providers.
- He frames a company's purpose as maximizing profit and shareholder value.
50:00
Quiz Release Conditions and the Shares-Issued Question
- Jeff reminds students to verify the release conditions for Quiz 1 and watch required videos; expired course windows may have corresponding videos on his YouTube channel.
- He identifies “Financial Statements Intro 7” as a release condition and says its window was extended to October 23.
- After class, a student asks how companies decide how many shares to issue; Jeff asks the student to remind him so he can address it next class.
Summary, takeaways, and chapters were generated by AI from the video's transcript and may contain errors. The video belongs to its creator, Jeff Hunk.