fnb100f261013a
 Watch on YouTube →
Overview
Jeff Hunk reviews how revenue and variable and fixed costs build the income statement, then uses revenue and cost curves to explain break-even output, profit maximization, and the distinction between maximizing revenue and maximizing profit. He introduces the balance sheet as a view of capital structure, illustrating how a hypothetical $10 billion in funding could support $9 billion of plant and equipment and $1 billion of working capital, and explains the trade-off between debt leverage and default risk.
Key takeaways
- Revenue equals price times quantity, while total variable cost equals unit production cost times quantity; in the lecture’s $300-per-unit example, both scale with output when everything produced is sold.
- Break-even output occurs where total revenue equals total cost; in a two-intersection model, profit is positive only between the first and second break-even quantities.
- The profit-maximizing output is where marginal revenue equals marginal cost, not necessarily where total revenue reaches its maximum.
- Fixed costs make total cost positive even at zero output; factory investment, rent, depreciation, and many clerical salaries illustrate different forms of fixed cost.
- A balance sheet connects funding sources to asset uses: the hypothetical $10 billion capital base is split between $9 billion of plant and equipment and $1 billion of working capital.
- Debt can amplify shareholder measures such as earnings per share and return on equity, but a larger debt share also raises default risk, making capital structure a trade-off rather than a choice between all-debt and all-equity funding.
Chapters
0:00
Class Opening and Income Statement Review
- Jeff Hunk opens the Tuesday class by returning to the financial-statement material covered in prior sessions.
- The recap centers on the income statement, with sales revenue and business expenses as its core components.
2:13
Sales Revenue, COGS, and the Cost of Output
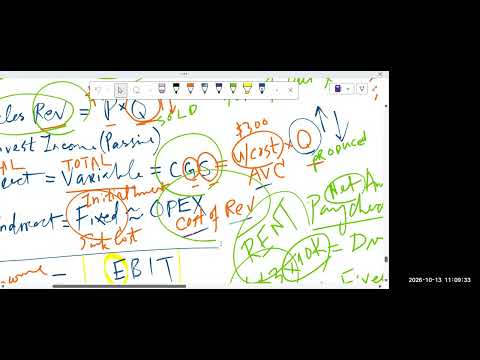
- Sales revenue equals price multiplied by quantity sold.
- Direct costs are variable costs, also called cost of goods sold (COGS); their total changes with production quantity.
- If a unit costs $300 to produce and all output is sold, revenue and COGS both change as quantity changes.
5:01
Unit Production Cost and Operating Profit
- Average variable cost is total variable cost divided by quantity, equivalent to unit production cost.
- Subtracting expenses from income reaches operating profit, also called EBIT: earnings before interest and taxes.
- In the lecture’s simplified model, production equals sales because a perfect demand forecast prevents shortages and surplus inventory.
8:59
From EBIT to Net Profit: Interest and Taxes
- Subtract interest from EBIT to reach EBT, or earnings before taxes, also called pretax profit or taxable income.
- Subtract taxes from EBT to arrive at net profit, or EAT—earnings after taxes.
- Hunk warns that calling operating profit “operating income” can blur the distinction between intermediate earnings and final profit.
13:27
Fixed Costs, Sunk Investment, and Rent
- Fixed costs do not vary with output; Hunk relates them broadly to operating expenses, or OPEX.
- A manufacturer must invest in a factory and production equipment before making its first product; this initial investment is a sunk cost.
- A coffee shop’s rent is fixed because it does not automatically rise or fall with the number of units sold.
18:47
Production Workers and Clerical Staff Have Different Cost Behavior
- Production-worker wages tend to vary with output because higher production requires more labor hours, workers, or both.
- Skilled assembly-line workers cannot necessarily be doubled overnight, and relying on overtime is limited by workers’ capacity.
- Secretarial and other clerical salaries generally do not need to double when production doubles, making them relatively fixed costs.
26:41
OPEX and the Microeconomics Cost-Curve Setup
- Examples of operating expenses include rent, utilities, fixed salary costs, depreciation, research and development, and marketing.
- Depreciation accounts for wear and tear that reduces the value of plant and equipment over time.
- Hunk groups many such expenses under SG&A—selling, general, and administrative expenses—and transitions to microeconomic revenue and cost curves.
30:35
Why Total Revenue Eventually Bends Under the Law of Demand
- Total revenue is price multiplied by quantity; with a constant price, it initially grows linearly as sales increase.
- Once a market for a $500 laptop becomes saturated, additional sales may require price cuts to $450, $400, or lower.
- As the price falls, total revenue grows more slowly and can eventually decline; the lecture treats $300 as the unit production cost in its example.
35:43
Fixed Costs Create a Nonzero Cost at Zero Output
- Total cost combines total variable cost and total fixed cost; variable cost rises with quantity while fixed cost remains.
- At zero units, variable cost is zero, but total cost is still positive because the business has already incurred fixed costs.
- The resulting cost curve starts at the fixed-cost amount rather than at the origin; Hunk pauses for an attendance check before continuing.
41:29
Break-Even Points and the Profitable Output Range
- Break-even points occur where total revenue intersects total cost, so revenue minus cost—and therefore profit—is zero.
- Output below the first break-even point produces a loss; output between the two break-even points produces a profit.
- Output beyond the second break-even point returns the business to losses because total cost exceeds total revenue.
47:38
Profit Maximization at Marginal Revenue Equals Marginal Cost
- The vertical distance between total revenue and total cost represents profit; its greatest positive distance marks maximum profit.
- At the profit-maximizing output, the revenue and cost curves have parallel tangents, meaning marginal revenue equals marginal cost.
- Finding that output is an optimization problem that can be handled with calculus or a suitably built spreadsheet or computer program.
50:53
Revenue Maximization, Shareholder Goals, and Management Incentives
- Revenue reaches its own maximum where the total-revenue curve stops rising, but that output need not maximize profit.
- Hunk describes profit maximization as serving shareholder wealth, while noting that management incentives may emphasize revenue growth or market share.
- Examples from AI competition include Google, OpenAI, Meta, Anthropic, Gemini, ChatGPT, Claude, Grok, Perplexity, and Copilot; he connects market share to revenue.
58:59
Class Break Before the Balance Sheet Lesson
- Hunk pauses after the income-statement and microeconomics discussion, noting that his throat is bothering him.
- The class resumes at 72:18 and shifts from operating activity and profit to the balance sheet.
1:12:24
The Balance Sheet Shows Capital Structure
- Hunk contrasts the income statement’s focus on profit with the balance sheet’s focus on capital structure.
- He simplifies the balance sheet’s financing side to debt and equity, rather than repeatedly spelling out liabilities.
- The balance sheet connects the sources of a company’s capital with the assets in which that capital is held.
1:15:01
Abstraction and Assets’ Income-Generating Capability
- Hunk presents abstraction as a concise way to express business relationships, such as revenue being a function of quantity.
- He argues that assets should be understood by their capacity to generate income, not only by labels such as current and non-current.
- Plant and equipment enable manufacturing, which in turn supplies retailers; Apple stores, for example, depend on iPhone production.
1:21:41
Plant and Equipment as a Major Initial Investment
- In the hypothetical business, $9 billion is needed for plant and equipment before production can begin.
- Plant and equipment are physical, real, or non-current assets funded by the company’s debt and equity.
- The example links the earlier idea of sunk cost to the assets required to establish manufacturing capacity.
1:23:25
A Hypothetical Dell Funding Mix: Debt and Equity
- Hunk invokes Michael Dell’s early computer business and venture-capital backing to illustrate how a company can obtain startup funding.
- Banks are described as conservative lenders that may hesitate to finance an unproven business idea, especially when the market is uncertain.
- In the simplified example, total debt and equity funding reaches $10 billion, of which $9 billion is allocated to plant and equipment.
1:29:09
Working Capital and the Balance Sheet Equation
- The remaining $1 billion in the hypothetical $10 billion capital base is working capital, held as cash, cash equivalents, or other liquid current assets.
- Working capital helps the business operate by paying workers and buying raw materials; equipment alone does not keep production running.
- The balance sheet balances because the $10 billion source of capital on the financing side matches $9 billion of non-current assets plus $1 billion of current assets.
1:33:17
Debt-Equity Mix and the Risk of Excessive Leverage
- Capital structure describes the proportions of debt and equity used to fund a company; Hunk illustrates alternatives such as 50/50, 60/40, and 70/30.
- A debt-heavy structure such as 95% debt and 5% equity increases default risk as required debt payments grow.
- A very equity-heavy mix is not automatically best either, so companies seek an optimal balance rather than simply eliminating debt.
1:36:29
Leverage, Shareholder Returns, and the Next Class
- Debt is called leverage because, like a physical lever, it can amplify the effect of a smaller amount of equity funding.
- Hunk says debt can raise earnings per share—net profit divided by shares—and return on equity, but the trade-off is greater financial risk.
- He postpones a fuller explanation of optimal capital structure and closes by saying he will try to attend the next day’s in-person class despite severe motion sickness.
Summary, takeaways, and chapters were generated by AI from the video's transcript and may contain errors. The video belongs to its creator, Jeff Hunk.