EDF9850_Example5a_Part2
 Watch on YouTube →
Overview
Lesa Hoffman uses a multilevel model of morning log-transformed glucose to distinguish how negative mood relates to glucose between people and from day to day within people. She tests whether individual reactivity varies and whether it differs by gender, then demonstrates how to interpret interactions, calculate women’s simple slopes in R, attribute pseudo-R², and check model implications in a plot.
Key takeaways
- Person-mean centering separates two distinct findings: each unit of daily negative mood above a person's own average predicts a 0.027 increase in next-morning log glucose, while each unit of higher average negative mood between people predicts a 0.08 increase.
- The random slope for daily negative mood was nearly zero and failed the likelihood-ratio test, so the model retained a random intercept and autocorrelation but did not support individual differences in reactivity.
- With men coded 0 and women coded 1, women’s estimated within-person mood slope is about 0.015 and remains significant, while their between-person slope is about 0.035 and is not significant.
- A gender-by-within-person-mood interaction is cross-level: it tests whether a Level 2 characteristic, gender, moderates the Level 1 daily mood effect.
- Pseudo-R² attribution follows the model equation: Level 2 predictors in the intercept equation explain random-intercept variance, while a cross-level interaction explains residual variance if no random slope is included.
- Interaction plots serve as model checks: parallel lines within gender match a model without a three-way interaction; different slopes between genders display the cross-level moderation.
Chapters
0:00
Model 2A: Testing Whether Negative Mood Predicts Next-Morning Glucose
- The research question is whether negative mood predicts morning glucose both between people and within people over time.
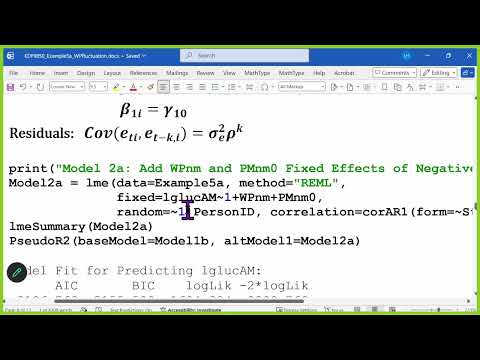
- Model 2A person-mean centers negative mood, retains the autocorrelation structure, and initially gives the within-person mood effect a fixed slope.
0:37
Interpreting Within-Person and Between-Person Mood Effects
- A within-person value of zero means a person's negative mood is at their own average; positive values indicate grumpier-than-usual days.
- Each unit more negative mood than usual predicts a 0.027 increase in next-morning log glucose, while each unit higher person-average negative mood predicts a 0.08 increase in average glucose.
- The effects represent different relationships: daily fluctuations within a person versus cross-sectional differences between people.
- Person-average negative mood explains 2.8% of random-intercept variance; daily deviations explain 1% of residual variance.
7:14
Testing Individual Reactivity with a Random Slope
- Model 2B adds a random slope so people can differ in how strongly daily negative mood relates to glucose.
- Adding that slope also adds its variance and its covariance or correlation with the random intercept.
- The estimated random-slope variance is nearly zero, and a likelihood-ratio test indicates it is unnecessary.
- The model retains the random intercept and residual autocorrelation but drops the random slope, implying insufficient evidence that reactivity varies across individuals.
12:35
Model 3: Testing Gender Differences in Mood Reactivity
- Despite the unsupported individual random slope, Hoffman tests the study's planned question of systematic gender differences in reactivity.
- Model 3 adds gender's main effect, its interaction with person-mean negative mood, and its cross-level interaction with daily negative mood.
- Gender moderation lets men and women have different slopes while assuming equal slopes among people within each gender.
- The random slope remains excluded; the model's interaction terms represent the specified gender differences.
15:18
Interpreting Gender Interactions and Women’s Simple Slopes
- With men coded 0 and women coded 1, the intercept and both negative-mood main effects describe men; the intercept is for an average-grumpiness man on an average day.
- Women have marginally higher glucose at that reference point, while both mood effects are weaker for women than for men.
- The within-person mood slope for women is approximately 0.045 minus 0.03, or 0.015; the between-person slope is approximately 0.16 minus 0.125, or 0.035.
- R's linear-combination tools provide standard errors and p-values: the within-person effect remains significant for women, but the between-person effect does not.
23:40
Using R Linear Combinations and Allocating Pseudo-R²
- Linear combinations add the relevant main effect and interaction to estimate a group's simple slope; recoding women as 0 and refitting is an alternative.
- A joint F test can assess all three gender terms together: the gender main effect and the two mood-by-gender interactions.
- In the pseudo-R² comparison, gender's main effect and its interaction with person-mean mood explain random-intercept variance; together they add 1.3%.
- The cross-level interaction explains residual variance when no random slope is present; if a random slope had been retained, it could instead explain variance in that slope.
31:16
Plotting Mood Effects and Checking Interaction Structure
- The plotted values use the within-person negative-mood mean and values one standard deviation above and below it.
- Men's lines are steeper than women's, illustrating the cross-level interaction; the greater separation between men's happy and grumpy lines illustrates a stronger between-person mood effect.
- Parallel lines within each gender are consistent with the fitted model; nonparallel lines would require an additional interaction, such as a three-way interaction.
- Hoffman recommends checking whether plotted lines match the model and notes that plotting code is available in R and Excel.
Summary, takeaways, and chapters were generated by AI from the video's transcript and may contain errors. The video belongs to its creator, Lesa Hoffman.