EDF9850_Example4a_Part2
 Watch on YouTube →
Overview
Lesa Hoffman develops a multilevel regression example showing how cross-level interactions explain variation in student SES and non-white effects across schools, and how to interpret the resulting fixed and random effects. Using R and lmerTest, she reports that school SES and composition explain about 18% of the non-white random-slope variance and that the expanded model explains about 55% of the SES slope variance, while warning that a singular fit can indicate redundant random effects.
Key takeaways
- A positive correlation between school math intercepts and a negative non-white random slope means that higher-math schools tend to have a weaker, less negative non-white effect.
- In Model 5B, school mean SES and school proportion non-white moderate the student non-white math slope; a 10-percentage-point increase in non-white school composition corresponds to about 0.29 units of weakening.
- The two school-level moderators explain about 18% of non-white random-slope variance but only about 0.1% of total math-score variance, illustrating that slope-specific and outcome-wide effect sizes answer different questions.
- Adding a second random slope to a model with an intercept and one slope adds three parameters: the new variance and two covariances with the existing random effects.
- A singular fit may indicate redundant random effects; in Hoffman's example, the two random slopes are nearly perfectly negatively correlated.
- The expanded SES model explains about 55% of SES slope variance, yet a borderline residual-variance test can remain because statistical detectability and the percentage explained are distinct measures.
Chapters
0:00
Interpreting the Random Intercept and Non-White Slope Correlation
- A positive correlation between school math intercepts and non-white random slopes means higher-math schools tend to have less negative slopes.
- Because the average non-white effect on math is negative, a less negative slope means non-white identity is associated with a smaller math-score gap in those schools.
1:23
Model 5B Adds Two Cross-Level Interactions
- Model 5B adds student non-white by school mean SES and student non-white by school proportion non-white interactions.
- Expanding the equation shows three fixed-effect terms for student non-white: its main effect and two level-two moderation terms, plus its random slope.
- In R, explicit colon notation makes the interactions visible; an asterisk includes both main effects and the interaction, while R places interaction terms at the end of the fixed-effect ordering.
5:43
Cross-Level Terms Explain Random-Slope Variation
- The two new fixed effects aim to explain why the student non-white slope differs among schools, using school mean SES and school composition as moderators.
- After adding moderators, the non-white random-slope term represents the remaining unexplained school-to-school variation.
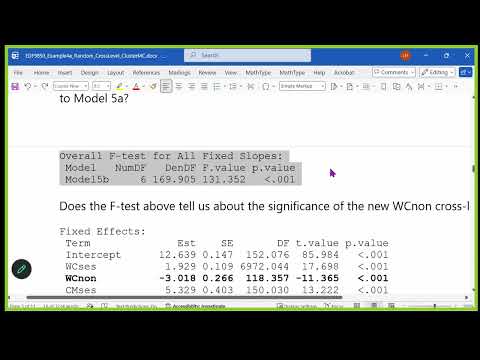
- The model-wide F test has six numerator degrees of freedom and tests all fixed slopes together, so it does not isolate the two new interactions.
8:34
Interpreting Moderation of the Non-White Math Effect
- The non-white main-effect estimate is about negative three for schools at the reference values: mean SES of zero and 30% non-white students.
- The SES interaction makes the negative non-white slope less negative as school mean SES rises, a weakening direction that is not statistically significant.
- The composition interaction also makes the non-white slope less negative; because school proportion ranges from zero to one, a 0.10 increase corresponds to about 0.29 weaker slope units.
- A significant interaction indicates school composition helps explain why the non-white math gap varies across schools.
14:39
Quantifying Explained Random-Slope Variance
- The likelihood-ratio test still detects non-white random-slope variance after adding both moderators, so school SES and composition do not explain every source of slope variation.
- The two moderators account for about 18% of the non-white slope variance, while their contribution to total math-score variance is only about 0.1%.
- Total R-squared uses fixed effects and does not change merely because a random slope is added.
- A custom F test using lmerTest's contestMD approach can test the two cross-level interaction coefficients as a set.
18:17
Adding a Random Slope for Student SES
- Adding a second random slope introduces three covariance parameters: the new slope variance and its covariances with the existing intercept and non-white slope.
- With an SES random slope, the intercept is conditional on student non-white being zero, student SES being at its school mean, and the random slopes being zero.
- Likelihood-ratio tests show that removing either random slope worsens model fit; the SES slope varies across schools and remains positive.
- The SES effect is estimated to range roughly from 0.6 to 3.2 across schools, so more student SES than the school average predicts higher math scores, with differing magnitudes.
24:20
Distinguishing Original and Leftover Random-Effect Variance
- The non-white random slope is leftover variance after controlling for school SES and composition, whereas the newly added SES random slope captures the full school-to-school variation in that effect.
- Random-effect confidence intervals for partially explained terms describe remaining deviations, not the original variation before moderators entered the model.
- The full model contains four variance components and can therefore have four corresponding pseudo-R-squared measures.
- A singular fit can signal a near-zero variance or an out-of-bounds correlation; here, the two random slopes are nearly perfectly negatively correlated, suggesting possible redundancy.
- Cross-level interactions may be selected according to theory, but the random slope should be tested before attempting to explain its variance.
32:04
Reading SES Interactions and the 55% Variance Result
- The within-school SES slope is about 1.9 math-score units for a student one unit above the school mean, conditional on the reference school SES and 30% non-white composition.
- Negative interactions weaken this positive SES slope as school mean SES or the proportion of non-white students increases; the composition coefficient is easier to interpret per 10 percentage-point increase.
- The model accounts for about 55% of SES random-slope variance, even though the remaining variance test is borderline significant.
- The two SES cross-level interactions are significant as a set, despite explaining a modest additional amount of variance.
36:11
Plotting Interactions, Considering Three-Way Terms, and Closing Activity
- A two-by-two interaction plot uses color for school mean SES and solid versus dashed lines for school composition; line slopes show within-school effects, their values at zero show between-school effects, and differences in slopes show moderation.
- The composition moderation of the SES slope is visible in solid-versus-dashed lines, while the largely parallel color-coded lines reflect the non-significant mean-SES interaction.
- A three-way interaction would let the effect of school composition on the SES slope vary with school mean SES; higher-order interactions require checking that plotted patterns match the model's terms.
- For the binary non-white predictor, centering creates an average value of zero that may be impossible for an individual student; the next class example addresses categorical predictors and centering complications.
- The class ends with a short course activity using a Shiny app and a Google Doc, with answers due on Canvas before the following week.
Summary, takeaways, and chapters were generated by AI from the video's transcript and may contain errors. The video belongs to its creator, Lesa Hoffman.