EDF9850_Example4a_Part1
 Watch on YouTube →
Overview
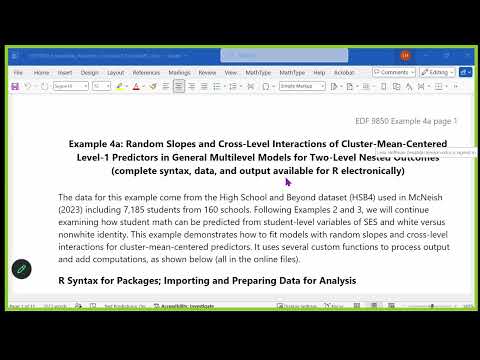
Lesa Hoffman develops a multilevel-model example using student math scores, student SES, non-white identity, and school-level predictors to show how random slopes add cluster-specific variation beyond random intercepts. She explains how to fit and interpret a random slope, assess it with a likelihood-ratio test, and use slope reliability and random-effect intervals without confusing variation across schools with variance explained; the session stops before its planned cross-level interaction models.
Key takeaways
- A random slope represents school-to-school variation in the effect of a student-level predictor; it is distinct from variation in that predictor's prevalence across schools.
- When adding a random slope, the model also estimates its covariance with the random intercept, so a likelihood-ratio comparison can add two parameters rather than one.
- A significant average slope and a random-effect interval that overlaps zero can coexist: the average effect may be negative while some schools have effects near or above zero.
- Cluster-mean-centering student predictors separates within-school effects from between-school effects, making their coefficients easier to interpret.
- Unsmooshing covariates can be important for adequate control, and omitting a needed random slope when testing a cross-level interaction can increase Type I error.
- Adding a random slope identifies another source of variation; it does not explain that variation until predictors account for differences in slopes.
Chapters
0:00
Project Plans, Homework 2, and Course Schedule
- Lesa Hoffman reports 100% submission of project plans and expects nine presentations, possibly ten, across two class periods.
- Project plan revisions are due in two weeks; approved plans earning five points do not need to be resubmitted.
- Homework 2 covers Example 3 and is due in two weeks; a formative assessment is planned for the following week.
4:00
Centering Constants and the Meaning of Random Slopes
- A level-two centering constant such as C2 makes zero meaningful for a cluster-mean predictor; no adjustment is needed when zero is already meaningful.
- A random slope adds cluster-level variation in a level-one predictor's effect, represented by U1 around the fixed, average slope.
- A negative slope deviation does not necessarily mean a negative slope: if the average is 6 and a cluster slope is 4, U1 is -2.
11:00
Visualizing Random Slopes and Cross-Level Interactions
- Parallel lines depict a random-intercept model with a common fixed slope; nonparallel cluster lines depict random slopes.
- The fixed slope is the center of the cluster-slope distribution, while U1 represents each cluster's deviation from that center.
- Level-two predictors can explain cluster differences in a level-one slope through cross-level interactions, which the next models will explore.
15:00
Why Covariates May Need to Be Unsmooshed
- Hoffman recommends separating within-cluster and between-cluster components for covariates as well as focal predictors.
- A smooshed covariate may not adequately control for a level-two association, changing other estimated slopes when included.
- Random slopes for covariates matter especially when testing their interactions; omitting a needed random slope can inflate Type I error for cross-level interactions.
18:00
Example 4A Data, Model Sequence, and Updated R Functions
- Example 4A reuses the school-and-student dataset from Examples 2 and 3, with student math, SES, and non-white identity.
- Hoffman's R function file now downloads its latest version from the internet and adds random-slope reliability calculations.
- Automatic saving of model objects is now off by default, reducing clutter in the R environment unless users explicitly enable it.
21:00
Model 4C: Cluster-Mean-Centered Predictors and Fixed Effects
- Model 4C cluster-mean-centers student SES and non-white identity so their level-one coefficients represent within-school effects.
- School mean SES and school proportion non-white, centered at 0 and 0.3 respectively, predict the school intercept.
- In the subscripts, a zero denotes a main effect and two level indices denote an interaction; at this stage, both student slopes are fixed across schools.
29:00
Reading Model Output and Distinguishing Values from Variances
- The residual e and random intercept U0C are individual-level values; their across-person and across-school variances are the model parameters.
- For Model 4C, residual variance is 36 and random-intercept variance is 2.6, not the values e or U0C themselves.
- Level-one gamma coefficients directly predict student math, while school-level gamma coefficients indirectly predict it through school-average characteristics.
35:00
Adding a Random Slope and Calculating Slope Reliability
- Hoffman adds a school-varying slope for within-school non-white identity, retaining the predictor as a fixed effect and adding its random term inside the school grouping parentheses in the model code.
- The random-slope deviation U2 creates a new variance component; sequentially adding slopes helps identify which addition improves model fit.
- Slope reliability, presented as an analogue to ICC2, compares slope variance with slope variance plus a rescaled residual component.
- For simulation-based power analysis, prior research can inform expected reliability; a sensitivity analysis can show power across a plausible reliability range.
43:00
Random-Effect Covariance, Conditional Intercepts, and Likelihood-Ratio Tests
- Adding a random slope also estimates its correlation with the school random intercept, since both random effects belong to the same school.
- A random intercept is conditional on predictors with random slopes being zero, just as a fixed intercept is conditional on predictors with fixed slopes being zero.
- A likelihood-ratio test compares nested models using the difference in minus-two log likelihood; smaller minus-two log likelihood indicates better fit.
- The random-slope comparison has two additional parameters, the slope variance and intercept-slope covariance, and the reference distribution may use a half chi-square mixture with 1 and 2 degrees of freedom.
49:00
What Significant Slope Variation Means Across Schools
- A significant random slope means the effect of student non-white identity on math differs across schools, not that the prevalence of non-white students differs across schools.
- The estimated average effect is about -3, while individual school effects may be closer to -4 or -2.
- Slope reliability is about 0.2 in this example, a modest signal despite statistically detectable variation across 160 schools.
- Adding a random slope reallocates variation into a new source to explain later; it does not itself explain variance or call for a new pseudo-R-squared.
54:00
Interpreting Random-Slope Intervals and the Intercept-Slope Correlation
- The average non-white identity slope is significantly negative, even though the interval describing variation across schools overlaps zero.
- Under a normal random-effects assumption, the random-effect interval describes the range expected across about 95% of schools, not uncertainty across repeated samples.
- A positive intercept-slope correlation can mean higher-math schools have less negative slopes when the slopes themselves are negative.
- The class pauses at about 55:10; cross-level interaction models are planned for the session's continuation.
Summary, takeaways, and chapters were generated by AI from the video's transcript and may contain errors. The video belongs to its creator, Lesa Hoffman.