8.1 - Debugging (2026-10-16)
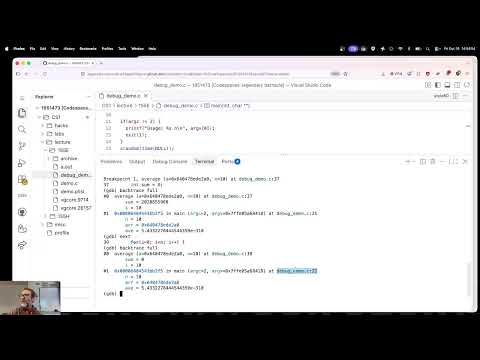 Watch on YouTube →
Overview
Chris Bourke demonstrates GNU GDB as a way to trace C program behavior, inspect memory and variables, and diagnose bugs that a segmentation-fault message alone cannot explain. Using a random-array and average example, he finds and fixes a missing return, an uninitialized sum, an off-by-one loop bound, integer division truncation, and a memory leak, while showing how compiler warnings and Valgrind complement debugging.
Key takeaways
- Compile C programs with GCC’s `-g` flag before using GDB; without debug symbols, source lines, function names, and variable names are unavailable.
- A segmentation fault identifies a failure point, but breakpoints and step-by-step inspection can reveal earlier causes, such as a function returning no array pointer.
- GDB’s `next`, `step`, and `continue` serve different purposes: advance within a function, enter a called function, or resume execution until another breakpoint.
- Watchpoints on loop variables and accumulators can expose boundary errors; an array of length 10 has valid indices 0 through 9, not 10.
- Integer division truncates in C when both operands are integers; casting an operand to `double` preserves a fractional average.
- GDB helps locate logic errors, while Valgrind can independently report memory problems such as the demo’s 40-byte allocation leak, fixed by calling `free`.
Chapters
0:00
Opening “Faith” Musical Interlude
- A sung interlude built around the repeated refrain “I got to have faith” opens the recording.
- The C debugging lesson begins at approximately 3:19.
3:19
Starting GDB with Debug Symbols, Arguments, and Breakpoints
- Compile with GCC’s `-g` flag so GDB can show source lines, variable names, and function names instead of only memory addresses.
- Launch GDB with the executable, use `set args 10` for the program’s command-line input, and run the program to reproduce its segmentation fault.
- Use `layout src` and `break 17` to inspect execution at a chosen line; a breakpoint can also target a function such as `random_array`.
- Use `next` to advance within the current function and inspect values such as `n` and array elements with `print`.
12:11
Finding Array and Average Bugs with GDB
- GDB inspection shows that `random_array` fills an array but returns no value, leaving the caller with an invalid pointer; enabling compiler warnings would have flagged the missing return.
- After fixing the return, `step` enters `average`, where inspecting `sum` reveals it was never initialized and must start at zero.
- Watchpoints on `i` and `sum` expose the loop’s extra iteration: for an array of 10 elements, the index must stop before 10.
- At a breakpoint before return, the sum is 45 for the displayed array; `sum / n` still produces 4 because both operands are integers, so one must be cast to `double`.
21:07
Using Valgrind to Confirm Memory Safety and Cleanup
- After correcting the average calculation, Bourke runs Valgrind to check for invalid memory accesses and other errors.
- Valgrind reports a 40-byte leak allocated by `malloc` at line 28, corresponding to the array returned to `main`.
- Calling `free(arr)` after the array is no longer needed removes the leak and yields a clean Valgrind report.
23:40
GDB Command Reference: Breakpoints, Watches, and Stack Frames
- Set breakpoints by line, function, or file-and-line, such as `break 14`, `break sum`, or `file.c:17`; remove them with `clear`.
- Use `next` to skip over function calls, `step` to enter them, and `continue` to run until the next breakpoint.
- Inspect variables and expressions with `print`; display an array by dereferencing its pointer and specifying its length, and use `watch` to report changes.
- `backtrace full` displays the call stack and in-scope variables for each frame; GDB can also set variables and call functions interactively.
30:37
Upcoming Tic-Tac-Toe Bug Hunt and Graphical Debugging
- The next Thursday lab is a Tic-Tac-Toe debugging exercise with five bugs; students can interact with the program through GDB as it prompts for input.
- The class will begin strings after the break, and there is no lab due the following week.
- Bourke briefly explores the CS50 IDE’s graphical debugger, noting that breakpoints can be clicked into place but launch configuration may be required.
Summary, takeaways, and chapters were generated by AI from the video's transcript and may contain errors. The video belongs to its creator, Chris Bourke.