Statistical Thinking in Science: Crash Course Scientific Thinking #2
 Watch on YouTube →
Overview
Hank Green explains how to critically interpret statistics encountered in everyday life, moving beyond simple averages to understand concepts like median, mode, standard deviation, and confidence intervals. The video emphasizes that context is crucial, differentiating between absolute and relative risk, and highlighting the difference between correlation and causation, with confounding variables like warm weather impacting ice cream sales and shark attacks.
Key takeaways
- Statistics like mean, median, and mode offer different perspectives on 'typical' values, each with unique sensitivities to data distribution.
- A 95% confidence interval means a study's results would fall within that range 95 out of 100 times if repeated.
- Relative risk can inflate perceived danger; absolute risk provides a more grounded understanding of actual impact (e.g., 100% increase from 1 in 7,000 to 2 in 7,000).
- Correlation describes a relationship, but causation requires evidence of one variable directly influencing another, accounting for confounding variables.
- Statistical significance means a result is unlikely due to random chance, not necessarily that it's important or meaningful in a real-world context.
- Understanding the context and precision (confidence intervals) of statistical data is crucial for making informed decisions.
Chapters
0:00
Understanding 'Typical' with Mean, Median, and Mode
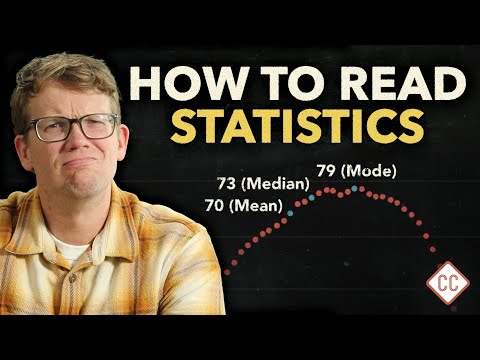
- The mean (average age of death for US men, 70) can be skewed by outliers.
- The mode (most common age of death, 79) represents the most frequent occurrence.
- The median (middle value, 73) is less affected by extreme values and represents the midpoint.
- Standard deviation quantifies the spread of data points around the mean.
6:55
Confidence Intervals and the Precision of Statistics
- Confidence intervals provide a range within which a statistic is expected to fall a certain percentage of the time (e.g., 95%).
- A higher confidence interval indicates greater trust in the statistic's reliability.
- Statistics have two key components: the number itself and the precision with which it's known.
- It's better to be roughly right than precisely wrong when interpreting data.
8:52
Absolute vs. Relative Risk and Correlation vs. Causation
- Relative risk (e.g., 100% increase in blood clot risk) can be misleading without absolute risk (2 in 7,000).
- Pregnancy poses a higher blood clot risk than certain birth control pills.
- Correlation indicates a relationship between variables (e.g., sunscreen use and lower skin cancer rates).
- Correlation does not imply causation; confounding variables (e.g., warm weather) can influence both correlated factors.
Summary, takeaways, and chapters were generated by AI from the video's transcript and may contain errors. The video belongs to its creator, CrashCourse.