Stanford CS547 HCI Seminar | Spring 2026 | Show It or Tell It? Text, Visualization, and Combination
 Watch on YouTube →
Overview
This seminar explores the complex interplay between text and visualizations, arguing that language is a crucial, yet often underexplored, component of effective information design. Research presented challenges minimalist design principles by showing that more text can improve understanding, while also highlighting how cognitive models and multimodal LLMs offer potential frameworks for understanding how humans and AI process combined textual and visual information.
Key takeaways
- Contrary to minimalist design trends, research indicates that providing more relevant text annotations on visualizations can improve user understanding and recall.
- Textual information can significantly influence perceptions of author bias in data presentations, even if it doesn't alter predictions.
- Cognitive models like Dual Process Theory (System 1 vs. System 2 thinking) offer a potential explanation for why visual perception might dominate over textual cues in certain prediction tasks.
- Multimodal Large Language Models (LLMs) employ sophisticated architectures like cross-attention to integrate visual and textual inputs, processing them in distinct layers for semantic understanding and response generation.
- The effectiveness of combining text and visualizations is highly context-dependent, influenced by the specific task, user abilities, and the precise design of the elements.
- Visualizations embedded directly within paragraphs of text can impede fluent reading due to their attention-grabbing nature, a phenomenon currently under active research.
Chapters
0:00
Introduction: Text and Visualization Intersection
- The speaker's long-standing interest in the intersection of text and visualization, dating back to PhD work in 1995.
- Recent focus on cognitive underpinnings and the role of multimodal LLMs.
- Talk structure: design combinations, cognitive models, and LLMs.
3:23
The Role of Text in Information Visualization
- Information visualization defined as systematic spatial representations of data.
- Anscombe's quartet demonstrates how visualizations reveal patterns not apparent in statistics.
- Historically, text (titles, annotations) was neglected in visualization design guidelines (e.g., Apple's).
5:33
Empirical Evidence for Text's Importance
- Study 'Beyond Memorability' found titles and labels received the longest fixations and were most recalled.
- Language is a key component of visualization, but interaction is not well understood.
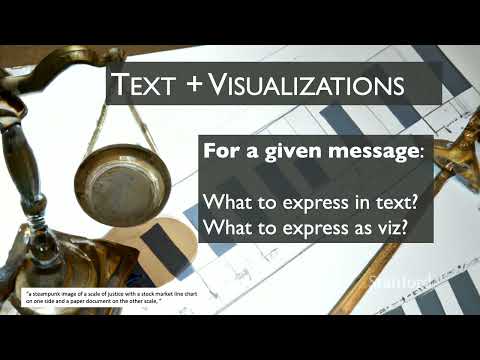
- Key questions: what to express in text vs. visualization, and the optimal balance.
7:20
Caption Salience and Influence
- Research by Agarwala et al. investigated chart attention and caption influence.
- When captions aligned with visually salient chart features, participants recalled the salient feature.
- When captions highlighted non-salient features, those takeaways were mentioned more, demonstrating caption dominance.
10:22
Textual Descriptions for Accessibility
- Lundgard and Satyanarayan's work on alt tags for visualizations for Blind and Low Vision (BLV) users.
- Categorized text descriptions: high-level (external info), trends, and low-level (specific values).
- BLV users preferred low-level descriptions, while sighted users favored high-level ones.
13:42
How Much Text is Optimal on a Chart?
- Experiment varied text quantity on charts (none, title, annotations, subtitle, extensive text).
- Results showed 'more text is better,' challenging Tufte-esque minimalism.
- A significant minority preferred no chart or minimal text, but the majority favored more annotations.
20:14
Text Annotation Impact on Predictions
- Study on predictions using ambiguous charts (e.g., market share trends).
- Text annotations largely did not affect viewer predictions about future outcomes.
- However, text annotations strongly signaled potential author bias.
24:10
Text and Visualization in Comparisons
- Comparisons are complex in both language and visuals.
- Visualizations allow comparing many data points; text is limited to a few.
- Work with Tableau explored how to answer comparative questions ('tallest buildings') using linguistics and visualization.
30:30
Visualizations in Chat Interfaces
- Research on embedding visualizations in chat interfaces for comparative questions (e.g., 'weightlifting vs. taekwondo events').
- Participants preferred more bars (visualizations) for context over text alone, but 41% still preferred no visualization.
- Reasons for preferring text: precision, simplicity; reasons for preferring viz: context for surprising information.
35:43
Text Alone as a Design Option
- Evidence suggests text-alone options are favored by sizable minorities (e.g., 41% in chat context, 14% in data viz).
- Ottley et al. found no accuracy difference for Bayesian reasoning between text and viz, but combined modes didn't leverage distinct affordances.
- NYT 'You Draw It' study showed statistics as text aided recall of specific values, while visualizations aided trend recall.
40:25
Cognitive Models: Reading and Fluency
- Visualizations within text paragraphs can distract from fluent reading.
- Reading is an acquired skill; parafoveal preview aids word recognition and fluency.
- Insertion of non-alphanumeric visuals may impede fluent reading; research is ongoing.
48:45
Cognitive Models: Dual-Coding vs. Cognitive Load
- Dual-coding theory suggests independent visual and verbal subsystems enhance memory.
- Cognitive load theory posits that simultaneous transmission can overload working memory.
- Conflicting evidence exists; preference for text alone may relate to low visual/verbal abilities or working memory capacity.
55:40
Dual Process Theory and Visualization
- Dual process theory (System 1: automatic, System 2: effortful) applied to visualization interpretation.
- System 1 can lead to perceptually biased, incorrect answers (e.g., estimating average value from a chart).
- System 2 requires deliberate calculation and overrides System 1, potentially explaining why text didn't sway predictions.
Summary, takeaways, and chapters were generated by AI from the video's transcript and may contain errors. The video belongs to its creator, Stanford Online.