Section 10.1 - Graphs of Systems of Linear Equations
 Watch on YouTube →
Overview
Monica Brannan works through Section 10.1 homework on graphing and interpreting systems of linear equations, demonstrating point substitution, line classification, slope comparisons, intercepts, and graph-based solutions. Examples show how intersections identify unique solutions, while coincident lines produce infinitely many solutions; a final Desmos calculation approximates a decimal-coefficient system’s solution as (0.783, -12.133).
Key takeaways
- A point solves a system only if its coordinates make every equation true; one failed equation is enough to rule it out.
- Equations of the form x = c graph as vertical lines, while equations of the form y = c graph as horizontal lines.
- When two lines intersect once, the intersection coordinates are the system’s unique solution; coincident lines instead yield infinitely many solutions.
- Equal slopes indicate parallel lines, while slopes that are negative reciprocals indicate perpendicular lines.
- To find intercepts from an equation, set y = 0 for the x-intercept and x = 0 for the y-intercept.
- Desmos can approximate intersections of decimal-coefficient systems, with coordinates rounded to a requested precision such as three decimal places.
Chapters
0:00
Test Candidate Points in a Two-Equation System
- For the system x − y = 5 and 4x + 3y = −3, substitute each proposed point into both equations.
- (3, −2) satisfies x − y = 5 but fails the second equation; (5, 0) also fails the second equation.
- (2, 3) fails the first equation, so it can be rejected without checking the second.
4:46
Recognize Horizontal, Vertical, and Slanted Lines by Equation Form
- A vertical line has the form x = a number, while a horizontal line has the form y = a number.
- An equation containing both x and y generally describes a slanted line.
- The equation 10 = −4y rearranges to y = −5/2, so its graph is horizontal.
8:56
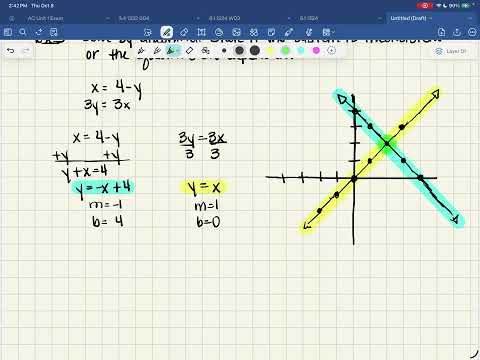
Graph y = −x + 4 and y = x to Find Their Intersection
- Rewrite x = 4 − y as y = −x + 4, and simplify 3y = 3x to y = x.
- Graph the first line from y-intercept 4 with slope −1, and the second from the origin with slope 1.
- The lines intersect at (2, 2), giving the system one unique solution rather than an inconsistent or dependent system.
14:39
Graph a Slope-Intercept Function and a System with y = 3
- For y = (4/7)x + 1, plot the y-intercept (0, 1) and use rise 4, run 7 to locate (7, 5).
- In the next system, k(x) = 3 is the horizontal line y = 3; f(x) = (9/7)x + 3 has the same y-intercept.
- The graphs meet at (0, 3), so the system has exactly one solution.
21:29
Identify Perpendicular Lines and Calculate Both Intercepts
- The lines with slopes 8/5 and −5/8 are perpendicular because their slopes are negative reciprocals.
- For 3x − 6y = 18, set y = 0 to find the x-intercept (6, 0).
- Set x = 0 to find the y-intercept (0, −3).
25:50
Verify Solutions and Graph a Vertical-Horizontal Line Pair
- For x + 2y = 4 and y = −(1/2)x + 2, the points (−2, 3), (4, 0), and (3, 1/2) satisfy both equations.
- Because the two equations describe the same line, the system is dependent and has infinitely many solutions.
- The system y + 8 = 5 and −3 = 2x simplifies to y = −3 and x = −3/2; its horizontal and vertical lines intersect at (−3/2, −3).
34:46
Approximate a Decimal-Coefficient System with Desmos
- Enter both decimal-coefficient equations into Desmos or a graphing calculator to locate their intersection.
- Use the graph’s intersection readout and round each coordinate to three decimal places.
- The approximate solution is (0.783, −12.133).
Summary, takeaways, and chapters were generated by AI from the video's transcript and may contain errors. The video belongs to its creator, Monica Brannan.