PHYS/OCSC 2300 - Fall 2026 - Lecture 8
 Watch on YouTube →
Overview
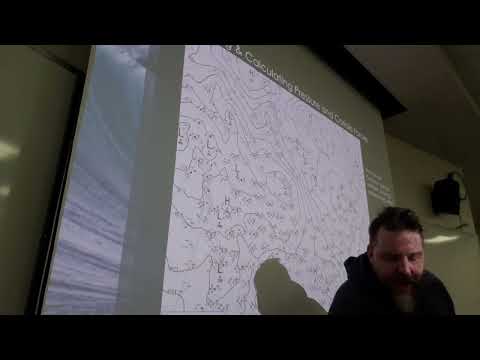
Joe Fitzgerald uses an Environment Canada surface-analysis map near Newfoundland to estimate the pressure-gradient and Coriolis forces on a 750 km by 750 km by 1 km air slab. The estimates—about 2 × 10¹² N for the net pressure force and 1 × 10¹² N for the Coriolis force—illustrate geostrophic balance, then lead into how Earth’s rotation organizes atmospheric circulation into Hadley, Ferrel, and Polar cells.
Key takeaways
- For a 750 km by 750 km by 1 km air slab near Newfoundland, a 1.2 kg/m³ air density implies a mass of about 6.8 × 10¹⁴ kg.
- At 50° N, a southwestward wind of about 12 m/s gives an estimated Coriolis force of 1 × 10¹² N toward the northwest.
- Large individual pressure forces can be around 10¹⁴ N while their small difference across a slab is about 2 × 10¹² N; the pressure gradient, not either total force alone, determines the net push.
- Geostrophic balance describes the approximate opposition between pressure-gradient and Coriolis forces; the wind adjusts until these forces are comparable.
- Near the surface, pressure force can slightly exceed Coriolis force, allowing air to spiral into a low and add mass to its atmospheric column.
- Earth’s rotation organizes global overturning into Hadley, Ferrel, and Polar cells, with key rising and sinking zones near the equator, 30°, 60°, and the poles.
Chapters
0:00
Pressure Gradients, Coriolis Deflection, and Global Circulation
- Uneven solar heating warms the equator more than the poles and drives atmospheric motion, which in turn drives much of the ocean circulation.
- Pressure forces push air from high pressure toward low pressure; Earth’s rotation adds the Coriolis deflection.
- Without planetary rotation, equatorial heating would support one large equator-to-pole convection cell.
7:40
Reading an Environment Canada Surface Analysis Near Newfoundland
- Dark contour lines mark surface pressure in hectopascals; the map shows a low near 1010 hPa and a high near 1030 hPa.
- Wind barbs show wind direction and speed: feathers encode speed, with the example of about 3.5 feathers corresponding to roughly 18 m/s.
- The calculation focuses on a slab of air near Newfoundland, using pressure contours and wind-barb observations as inputs.
12:00
Defining the Air Slab and Its Coordinate System
- The air parcel is approximated as a square slab with horizontal dimensions L by L and vertical thickness H.
- Joe estimates the wind at about 12 m/s toward the southwest and rotates the axes so x points northeast and y northwest.
- The slab’s southeast and northwest sides have estimated pressures of about 1005 hPa and 1030 hPa, respectively.
17:45
Estimating the Coriolis Force on a 6.8 × 10¹⁴ kg Slab
- The Coriolis component is calculated from mass, Earth’s angular velocity, the perpendicular wind component, and sin(latitude).
- Using a latitude of 50° N, sin(50°) ≈ 0.77, and Earth’s rotation rate of 7.27 × 10⁻⁵ rad/s gives an estimated force near 1 × 10¹² N.
- A surface air density of 1.2 kg/m³, slab dimensions of 750 km by 750 km by 1 km, and mass of about 6.8 × 10¹⁴ kg produce the estimate.
- The force points northwest, to the right of the slab’s southwestward motion in the Northern Hemisphere.
27:15
Calculating Net Pressure Force and Geostrophic Balance
- Pressure force is pressure multiplied by the sidewall area; a 750 km by 1 km wall has an area of 7.5 × 10⁹ m².
- The opposing southeast and northwest pressure forces are each about 7.5–7.7 × 10¹³ N, but their difference is only about 2 × 10¹² N.
- The net pressure force points toward lower pressure and opposes the roughly 1 × 10¹² N Coriolis force.
- This approximate opposition is geostrophic balance; the wind speed adjusts so the two large-scale forces become comparable.
35:30
Why Surface Lows Draw Air Inward
- In the example, surface pressure force is about twice the Coriolis force, a rough difference attributed to estimates and surface conditions.
- Because pressure slightly wins near the surface, air spirals inward toward a low rather than circulating around it without entering.
- Inward flow adds air to the low-pressure column, tending to raise its pressure and fill the low.
37:25
Earth’s Rotation Splits the Overturning Flow into Three Cells
- Coriolis deflection prevents air from moving directly from the equator to the poles in one uninterrupted convection cell.
- The Hadley cell rises near the equator and sinks around 30° latitude; the Ferrel cell sinks near 30° and rises near 60°.
- The Polar cell rises near 60° and sinks over the poles, completing three interlocking circulation cells in each hemisphere.
- Rising air at the warm equator and alternating rising and sinking zones help reconstruct the cell pattern.
42:40
Seasonal Changes in the Three-Cell Circulation
- Annual-average circulation data show strong Hadley cells, mid-latitude Ferrel cells, and comparatively weak Polar cells.
- The circulation pattern differs between December–February Northern Hemisphere winter and June–August summer.
- Joe defers a closer examination of the seasonal data and atmospheric cells until after the midterm.
Summary, takeaways, and chapters were generated by AI from the video's transcript and may contain errors. The video belongs to its creator, JoeFitzgeraldPhysics.