Math 30 - Day 6 - Transformation of Functions
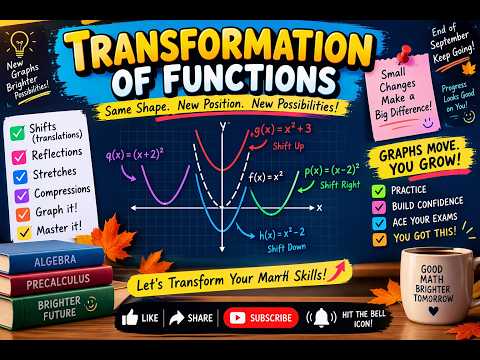 Watch on YouTube →
Overview
Christopher Lee teaches how to transform toolkit-function graphs through vertical and horizontal shifts, reflections, and stretches or compressions. He connects each formula change to its effect on graph coordinates and tabular inputs or outputs, then applies the rules to square-root, absolute-value, quadratic, reciprocal, and polynomial examples, including tests for even and odd symmetry.
Key takeaways
- For g(x) = f(x) + k, add k to every output: positive k shifts a graph up, while negative k shifts it down.
- For g(x) = f(x - h), positive h shifts a graph right and negative h shifts it left; the sign inside the function works opposite to the direction of movement.
- Vertical reflections use -f(x) and mirror across the x-axis, while horizontal reflections use f(-x) and mirror across the y-axis.
- A function is even when f(-x) = f(x), odd when f(-x) = -f(x), and neither when it satisfies neither identity.
- In g(x) = a f(x), a > 1 stretches vertically and 0 < a < 1 compresses vertically; in g(x) = f(bx), those horizontal effects reverse, so 0 < b < 1 stretches horizontally.
Chapters
0:00
Function Transformations as Flexible-Mirror Distortions
- Christopher Lee introduces transformations as ways to adapt toolkit functions to model real-world processes.
- The lesson covers shifts, reflections, stretches, and compressions of function graphs.
2:00
Vertical Shifts Change Function Outputs
- For g(x) = f(x) + k, adding the constant k changes every output while leaving inputs unchanged.
- A positive k moves the graph up; a negative k moves it down.
- Lee illustrates the rule by shifting the cube-root graph up one unit.
5:00
Build a Vertical Shift from a Function Table
- To tabulate g(x) = f(x) - 3, subtract 3 from every output in the original table.
- For original outputs 1, 3, 7, and 11, the transformed outputs are -2, 0, 4, and 8.
- The input row stays unchanged because the transformation acts outside f.
6:00
Horizontal Shifts Reverse the Sign Inside the Function
- A horizontal shift changes the input rather than the output, so it affects the graph's domain.
- In g(x) = f(x - h), positive h shifts the graph right and negative h shifts it left.
- Thus f(x + 1) moves one unit left, while f(x - 2) moves two units right.
10:00
Interpret Horizontal Shifts Through Input Changes
- Lee contrasts G(m) + 10, which increases the output by 10, with G(m + 10), which changes the input.
- If G(m) measures gas needed for m miles, G(m + 10) represents gas required for 10 additional miles.
- The distinction is that outside changes affect outputs and inside changes affect inputs.
14:00
Work Through the Input-Shift Table Carefully
- Lee revisits a table-based horizontal shift and pauses when the input mapping proves confusing.
- For g(x) = f(x - 3), each original plotted point moves three units right while keeping its output.
- The example reinforces that horizontal transformations change x-coordinates, not y-coordinates.
20:00
Shift the Quadratic Vertex Two Units Right
- The toolkit graph f(x) = x² becomes g(x) = (x - 2)² when shifted two units right.
- The vertex moves from (0, 0) to (2, 0), providing a reference point for checking the sign.
- Subtracting inside the input produces a rightward shift.
24:00
Identify a Square-Root Graph Shift from Its Starting Point
- For f(x) = √x, the transformation f(x + 2) shifts the graph two units left.
- The graph's starting point moves from (0, 0) to (-2, 0), with the same square-root shape.
- The example asks learners to classify the shift as horizontal, specify its direction, and give its two-unit magnitude.
30:00
Combine Horizontal and Vertical Shifts in Either Order
- Outside constants change y-values, while inside constants change x-values.
- Lee recommends identifying both shifts from the formula and applying them in either order.
- A positive constant added to the input shifts left; a positive constant added outside shifts up.
35:00
Transform the Absolute-Value V with Two Shifts
- Starting with f(x) = |x|, h(x) = f(x + 1) - 3 shifts the V one unit left and three units down.
- The vertex moves from (0, 0) to (-1, -3).
- The original absolute-value shape is preserved because both operations reposition the graph without rescaling it.
40:00
Use a Reciprocal Function to Write a Shift Formula
- For the reciprocal toolkit function f(x) = 1/x, a one-unit right shift gives 1/(x - 1).
- Adding 1 outside produces a one-unit upward shift: g(x) = 1/(x - 1) + 1.
- The example combines an inside horizontal change with an outside vertical change.
42:00
Reflect Graphs Across the Coordinate Axes
- The vertical reflection across the x-axis is g(x) = -f(x), which negates every output.
- The horizontal reflection across the y-axis is g(x) = f(-x), which negates every input.
- These operations mirror the graph across the named axis.
45:00
Apply Reflections to Function Tables
- For a vertical reflection, retain each x-value and multiply its output by -1.
- For a horizontal reflection, negate each x-value while keeping its paired output unchanged.
- Lee demonstrates the rules with table inputs 2, 4, 6, and 8 and outputs 1, 3, 7, and 11.
1:00:00
Recognize Even and Odd Graph Symmetry
- An even function satisfies f(-x) = f(x) and is symmetric about the y-axis.
- An odd function satisfies f(-x) = -f(x) and is symmetric about the origin.
- The examples include x² and |x| as even functions, and x³ and 1/x as odd functions.
- A function can be neither; the zero function is both even and odd.
1:03:00
Test Evenness and Oddness by Substituting Negative Inputs
- To classify a formula, substitute -x for x and compare the result with f(x) and -f(x).
- For f(x) = x³ + 2x, substitution gives -x³ - 2x = -f(x), so the function is odd.
- Matching the original formula indicates evenness; matching its negative indicates oddness; matching neither means neither.
1:13:00
Check Polynomial Symmetry Term by Term
- For a polynomial containing only even powers, such as s⁴ + 3s² + 7, substituting -s leaves the expression unchanged.
- A mixed expression such as x² + 3x + 27 becomes x² - 3x + 27, which is neither the original nor its full negative.
- Even and odd classification follows from the complete substituted expression, not from one term alone.
1:17:00
Vertical Scaling Multiplies the Function's Outputs
- For g(x) = a f(x), the factor a multiplies every y-value while leaving x-values fixed.
- If a > 1, the graph stretches vertically; if 0 < a < 1, it compresses vertically.
- If a < 0, the transformation also reflects the graph across the x-axis.
1:25:00
Apply Vertical Stretches and Compressions to Tables
- A vertical scaling table keeps its input row and multiplies each output by the scale factor.
- Multiplying outputs by 1/2 changes 1, 3, 7, and 11 into 0.5, 1.5, 3.5, and 5.5.
- Lee also demonstrates multiplying outputs by 3/4, which can be calculated as multiplying by 3 and dividing by 4.
1:30:00
Horizontal Scaling Reverses the Stretch-and-Compress Pattern
- For g(x) = f(bx), the scale factor acts on the input and changes horizontal width.
- If b > 1, the graph compresses horizontally; if 0 < b < 1, it stretches horizontally by a factor of 1/b.
- A negative b combines horizontal scaling with a reflection across the y-axis.
1:38:00
Scale a Function Table Horizontally by One-Half
- A horizontal transformation changes the input row while retaining the corresponding output values.
- Multiplying original inputs 2, 4, 6, and 8 by 1/2 gives transformed inputs 1, 2, 3, and 4.
- Because the input multiplier is below 1, the graph is stretched horizontally.
1:42:00
Wrap Up the Function-Transformation Rules
- The lesson closes after tabulating a horizontal stretch, with the x-values changed and the function outputs preserved.
- Shifts reposition graphs, reflections mirror them, and scaling changes their width or height.
- The final comparison distinguishes inside transformations on inputs from outside transformations on outputs.
Summary, takeaways, and chapters were generated by AI from the video's transcript and may contain errors. The video belongs to its creator, Christopher Lee.