Lecture 14: Hurricane Tracker
 Watch on YouTube →
Overview
A hurricane tracker uses Python’s turtle graphics to plot storm coordinates on an Atlantic map, with wind speed determining the storm category and color. The lesson explains how to configure the starter files and map coordinates, then practices CSV parsing with Pokémon data to teach line splitting, type conversion, finding top values, and insertion sort.
Key takeaways
- Configure turtle world coordinates so X maps to longitude and Y maps to latitude, and pass coordinates to goto in that order even when the CSV lists latitude first.
- Extract the hurricane CSV’s latitude, longitude, and wind speed after skipping its header; use wind speed to choose storm category and color.
- CSV fields read from a file are strings, so values such as Pokémon total stats must be converted with int() before numerical comparisons.
- Use split(',') to divide simple CSV rows into fields, and apply strip only when the data contains unwanted boundary whitespace or quotation marks.
- A top-N list needs ordered insertion rather than replacing the first lower score; paired name and score lists can be traversed together with zip.
- Insertion sort places each item into a sorted portion of a list, while quicksort and Timsort provide alternative approaches suited to larger or partially ordered datasets.
Chapters
0:00
Hurricane Tracker Output and Starter Files
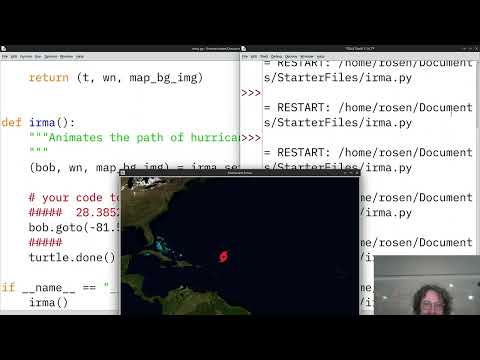
- The tracker draws a hurricane’s path, changes color as its category intensifies, and prints values along the route.
- Download and extract the starter-files ZIP before working; keep the supplied asset and data filenames unchanged.
- The project includes Atlantic map and hurricane images plus hurricane data stored in CSV files.
3:00
How the Starter Code Builds the Turtle Map
- The provided Irma code creates the turtle screen, sets its title, and creates the turtle named T.
- It loads atlanticbasin.png as the background and registers the hurricane image as a turtle shape.
- The code uses turtle screen world coordinates so map positions can correspond to longitude and latitude.
6:00
World Coordinates, the Irma Function, and Turtle Setup
- With world coordinates configured, the turtle’s X value represents longitude and its Y value represents latitude.
- Write project code inside the supplied Irma function and use the provided turtle rather than creating another one.
- On some systems, a blank turtle window can be resolved by adding turtle.done().
9:15
Plotting Walt Disney World with turtle.goto
- The coordinate example uses Walt Disney World in Bay Lake, Florida, to demonstrate direct turtle movement.
- Pass longitude first and latitude second to goto; latitude-longitude order from a data file must be rearranged.
- North and east coordinates are positive, while south and west coordinates are negative.
14:15
Reading Hurricane Coordinates and Wind Speed
- Each hurricane CSV row provides date, time, latitude, longitude, and other storm data, including wind speed.
- Skip the header row, extract latitude, longitude, and wind speed, then move the turtle to each coordinate.
- Use wind speed to determine the hurricane’s category and apply the specified colors, such as red for Category 5 and orange for Category 4.
16:00
Using Pokémon CSV Data to Practice File Reading
- A Pokémon CSV provides a larger practice dataset for learning file parsing before applying the same techniques to hurricane rows.
- Open the CSV from the same directory as the Python program; mismatched folders or filename capitalization can cause FileNotFoundError.
- The example introduces the data’s fields, including Pokémon ID, name, types, combat stats, and generation.
21:15
Loading CSV Rows with open and readlines
- Use open('pokemon.csv') to access the file, then data.readlines() to load its lines as strings in a list.
- Printing the first 10 rows provides a quick check that the file opened and its contents were read.
- The first CSV row is a legend containing column names, so it must be skipped before processing numeric values.
29:00
Splitting CSV Rows and Cleaning Pokémon Names
- Iterate through rows and call line.split(',') to turn each comma-separated row into a list of fields.
- In the example Pokémon data, index 0 holds the ID and index 1 holds the name.
- The string strip method removes unwanted leading or trailing characters, such as quotation marks; its exact use depends on the data.
35:15
Converting CSV Strings and Finding the Highest Stat
- The Pokémon total-stat value is at index 5, but CSV fields are strings and must be converted with int() before numeric comparison.
- Initialize a strongest score, compare each total against it, and update the score and Pokémon name whenever a larger value appears.
- Skipping the header prevents int() from trying to convert the text column label; across the full dataset, Eternatus has a total of 1,125.
42:15
Building a Top-Pokémon List with Parallel Lists
- To track multiple high scores, initialize lists for scores and names, then compare each Pokémon against the current entries.
- The example uses zip(names, scores) to iterate over corresponding values from the two lists.
- A shared variable such as N makes it easier to change the requested list size in one place.
50:00
Correcting the Top-List Logic with Ordered Insertion
- Replacing the first lower score can overwrite a valuable entry, so the list must preserve earlier high-ranking Pokémon.
- Use list.insert(index, value) for both score and name lists to place a new entry before the lower-ranked item.
- A missing break caused duplicate insertions and slow execution; stopping after the correct insertion fixed the behavior.
57:00
Insertion Sort and Its Connection to Hurricane CSV Parsing
- The list-building exercise demonstrates insertion sort: examine each item and insert it into the appropriate position in the sorted portion.
- The tracker uses the same core CSV skills—split each row, convert relevant fields, and use longitude and latitude as turtle coordinates.
- Insertion sort is intuitive, like placing a playing card into an ordered hand, but the demonstrated implementation leaves much of the list work to Python.
1:00:00
Comparing Insertion Sort, Quicksort, and Timsort
- Quicksort selects a pivot and partitions values into lower and higher groups; its worst case can be less favorable than merge sort.
- Timsort combines ideas from merge and insertion sorting and benefits from existing ordered runs in real-world data.
- Insertion sort can be effective for small lists, while more advanced methods tend to pay off as datasets grow; comparison sorting has an n log n lower bound in the general case.
Summary, takeaways, and chapters were generated by AI from the video's transcript and may contain errors. The video belongs to its creator, Professor Rosen.