Lecture 13: The Linear No-Threshold Theory
 Watch on YouTube →
Overview
Scott Kemp explains the Linear No-Threshold (LNT) model for radiation dose-response, emphasizing its statistical basis due to the complexity of biological mechanisms. He details the distinction between deterministic and stochastic diseases, focusing on cancer as the primary stochastic effect. Kemp discusses model selection principles, Bayes' rule, and information criteria (AIC/BIC), ultimately defending the LNT model's statistical justification despite its limitations and the practical impossibility of definitively proving or disproving thresholds with current experimental capabilities.
Key takeaways
- The Linear No-Threshold (LNT) model is statistically favored for radiation risk assessment because it is the simplest model that fits observed data, especially at low doses, despite incomplete mechanistic understanding.
- Detecting a radiation threshold would require impossibly large sample sizes (e.g., 56 million people) under even generous assumptions, rendering it practically unprovable.
- The 'look-again' effect and publication bias against null results can lead to spurious correlations (e.g., hormesis, jelly beans causing acne) and hinder scientific progress.
- Cancer arises from errors introduced during DNA repair processes, not solely from the initial DNA damage, making the repair mechanism itself a source of risk.
- Model selection principles like Occam's Razor and information criteria (AIC) guide the choice of simpler, more generalizable models over complex ones that may overfit data.
- The scientific publication system's emphasis on novelty over replication can lead to single, potentially flawed studies (e.g., hydroxychloroquine) unduly influencing policy and research directions.
Chapters
- Explains equivalent dose units (sieverts, REM) as energy per mass with adjustment factors.
- Notes that equivalent dose alone doesn't quantify cancer risk.
- Highlights the need for a dose-response model to link dose to health effects.
- Deterministic diseases (e.g., skin burns, cataracts) have intensity proportional to dose, often with a threshold.
- Stochastic diseases (e.g., cancer, genomic mutations) have probability proportional to dose, not intensity.
- Focus is on cancer as the primary stochastic health effect of concern.
- Statistical models correlate observed dose with cancer rate without understanding internal biological processes.
- Mechanistic models attempt to explain biological pathways (e.g., Compton scattering, DNA damage) but are limited by incomplete knowledge.
- The prevailing approach relies on statistical models due to the complexity of biological systems.
- Baseline risk: inherent probability of disease in a population (e.g., ~20% for cancer).
- Relative risk: ratio of exposed population risk to unexposed (control) group risk.
- Excess relative risk: (Relative Risk - 1), representing the additional risk due to exposure (e.g., 1% for a 21% total risk with 20% baseline).
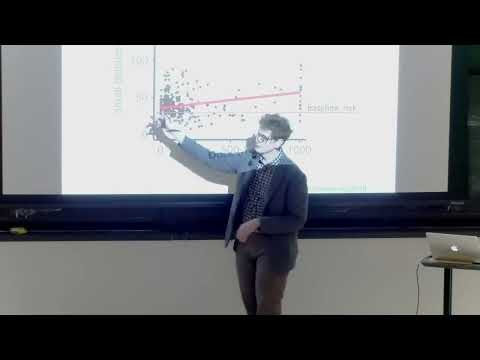
- Presents excess relative risk of solid cancer vs. colon dose from Japanese atomic bomb survivors (Life Span Study).
- Shows data points and a red line representing the Linear No-Threshold (LNT) model.
- Notes the LNT model's poor fit at high doses where data rolls over, indicating nonlinear effects.
- Analyzes DNA mutations in Chernobyl survivors' thyroid tumors, focusing on the low-dose regime (<1 Gray).
- Observes significant background mutations (~25 per genome) even at zero dose.
- Highlights data issues like dose reconstruction clustering and potential discontinuities.
- Questions the suitability of simple least squares fitting for non-Gaussian data.
- Explains that least squares assumes Gaussian distribution, which is inappropriate for count data like DNA deletions (cannot be negative).
- Suggests binomial distribution requires an appropriate regression model.
- Advocates for choosing simpler models when data is limited, based on Occam's Razor.
- A simpler model has fewer parameters and states, reducing the probability of coincidental data fit.
- Complex models require more data to be statistically justified.
- Derives Bayes' rule from basic probability definitions.
- Applies Bayes' rule to compare two models (Model 1 vs. Model 2) given data.
- The ratio of posterior probabilities depends on the ratio of likelihoods (probability of data given model) and priors (initial belief in models).
- Explains that the likelihood (P(Data|Model)) is key in comparing models.
- A simpler model (fewer states) has a higher probability of generating specific data compared to a complex model (many states).
- This mathematically demonstrates a preference for simpler models, as they are less likely to 'overfit' the data.
- Compares a simple linear model (y = alpha*x) with a piecewise threshold model (y = 0 below threshold, then beta*x - intercept).
- The threshold model introduces extra parameters (threshold value, intercept), increasing its complexity.
- More complex models require more data to be statistically defended.
- Cross-validation (e.g., k-fold) trains on subsets of data and tests on held-out data to measure prediction error.
- Bayesian Information Criterion (BIC) and Akaike Information Criterion (AIC) are scoring functions that penalize model complexity.
- AIC is generally preferred unless the true model is known to be within the evaluated set; it aims to minimize information loss.
- Presents k-fold cross-validation results for the Hiroshima Life Span Survey data, favoring the linear model.
- Despite visual cues suggesting nonlinearity, statistical analysis consistently supports the LNT model in the low-dose regime.
- The LNT model is statistically justifiable as the simplest model that adequately describes the data.
- Illustrates the 'look-again' effect using organ-specific cancer risks from radiation exposure.
- Shows a statistically anomalous result where uterine cancer risk appears lower, but this is likely a random fluctuation within error bars.
- Warns against cherry-picking results and the need for statistical adjustment (e.g., p-value correction) when testing multiple hypotheses.
- Discusses the concept of hormesis (low-dose radiation being beneficial) as often arising from the 'look-again' effect.
- Explains that upregulated DNA repair mechanisms after damage are a response, not evidence of benefit.
- The repair process itself can introduce errors leading to cancer.
- Revisits the Hiroshima Lifespan Survey data up to 2 Sieverts, showing a generally linear trend in the low-dose regime.
- Notes potential sub-linear or super-linear deviations but emphasizes that statistical justification favors the linear model.
- Highlights that the largest dataset (80,000 individuals, 64,000 < 100 mSv) still supports LNT.
- Compares the ICRP's recommended slope (0.53 per Sv) with slopes read from data (0.64 per Sv, or ~1 per Sv in low-dose regime).
- Argues that the LNT model is not necessarily conservative, as data might suggest a steeper slope.
- Reiterates that threshold models are not statistically supported by the available data.
- Calculates the sample size needed to detect a threshold at 1 millisievert.
- Assumes generous conditions: 10% baseline cancer risk, 1 excess relative risk per Sv, perfect experimental conditions.
- Requires a population of 56 million people to statistically distinguish between a threshold and LNT model, deeming it practically impossible.
Summary, takeaways, and chapters were generated by AI from the video's transcript and may contain errors. The video belongs to its creator, MIT OpenCourseWare.